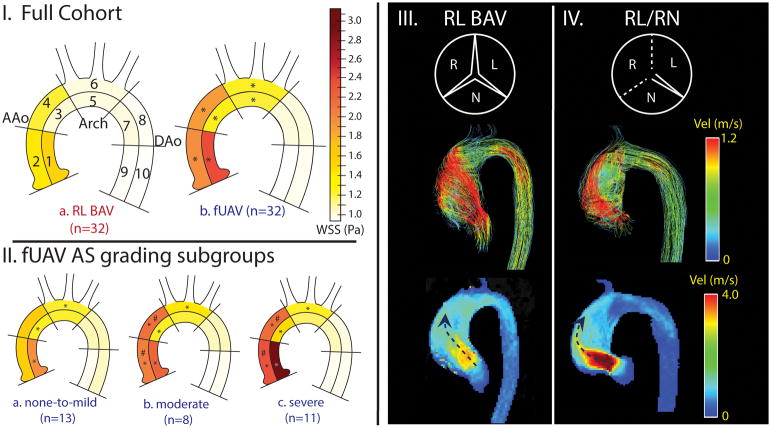
Figure 1.
I, AAo (regions 1–4), Arch (5,6), DAo (7–10) indicate where peak velocities were quantified. Separated ROIs (1–10 indicate where WSS was quantified. I, a) RL BAV compared to the a) entire fUAV cohort; II, fUAV stenosis subgroup comparison. (*) represents significant differences compared to the RL BAV group. (#) represents subgroup differences. Note the increased WSS in the AAo and arch in all fUAV fusion and stenosis subgroups in comparison to the RL BAV patients. III,IV top: valve morphology (dotted lines represent fusion), middle: systolic streamlines, bottom: velocity MIPs. While III and IV both show eccentric valve orifices and outflow jets accompanied by complex deranged flow, the MIPs show much higher velocity outflow jets in the RL/RN fUAV patient with severe AS compared to the RL BAV patient with no AS.

