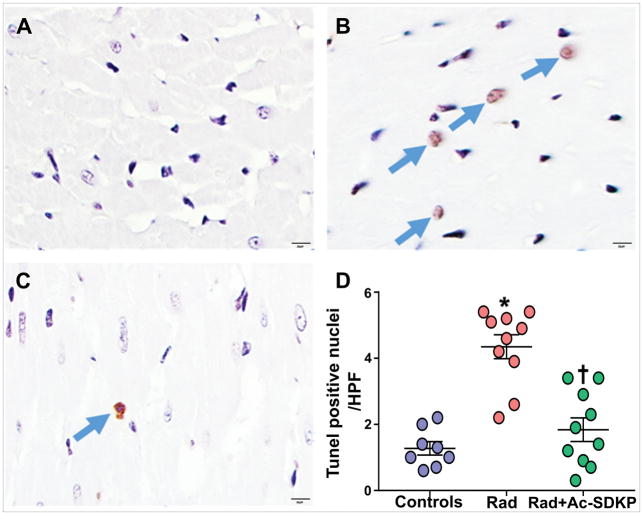
Figure 3. Analysis of cardiomyocyte DNA degradation by TUNEL staining of the myocardial sections.
Panel A–C show representative images in control (A), radiation exposed (B) and radiation + Ac-SDKP treated groups. Panel D: Represents quantification of tunnel stained myocyte nuclei per high power field. Arrows highlight TdT positive (apoptotic) myocytes. Magnification ×400. N = 8–10, *, P <0.001 radiation vs. control, †, P <0.001 radiation vs. radiation + Ac-SDKP.

