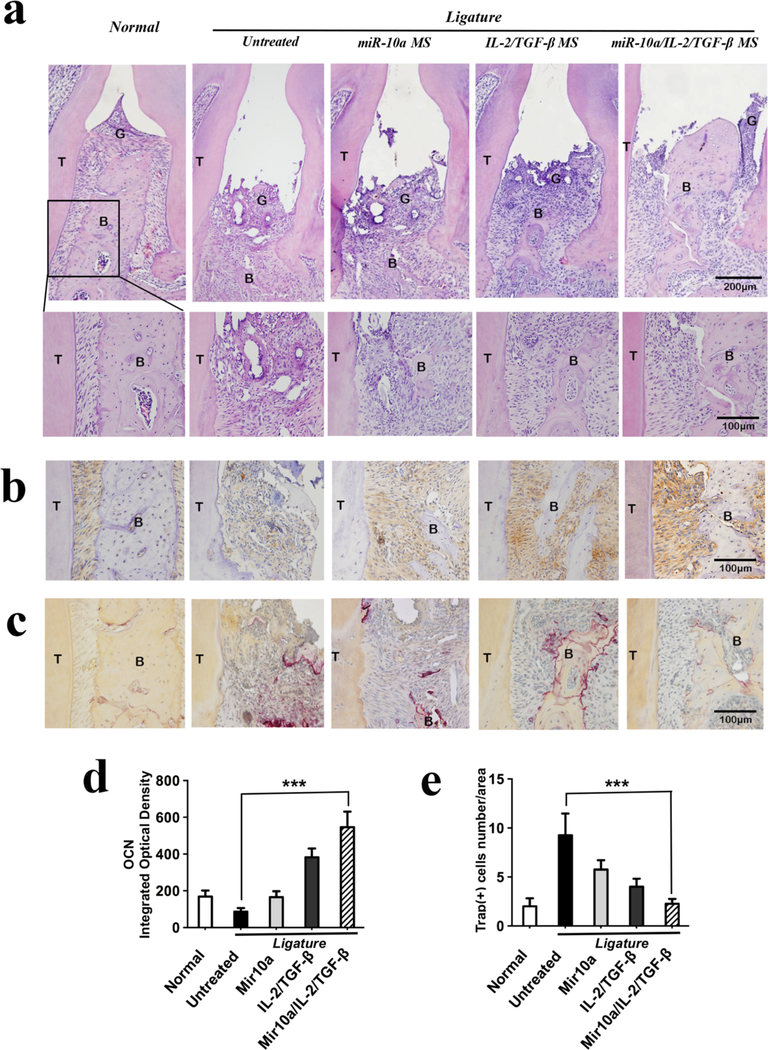
Figure 6. Histological analysis of maxillae in mouse periodontal disease model.
a) H&E staining results show the alveolar bone areas between the first and second molars in different treatment groups after ligation for 10 days; b) OCN immunostaining was very positive in the combined miR-10a/IL-2/TGF-β release group compared to all the other groups. c) The TRAP staining indicated minimal osteoclasts in healthy maxillae and in the miR-10a/IL-2/TGF-β NF-SMS treated maxillae, while there were significant numbers of osteoclasts in the other treatment groups. d) Quantitative analysis of cells with positive OCN immunostaining using Image-Pro Plus 6.0 software. e) The quantified TRAP-positive cells. Labels: Bone area (B), Gingiva (G) and Tooth (T).

