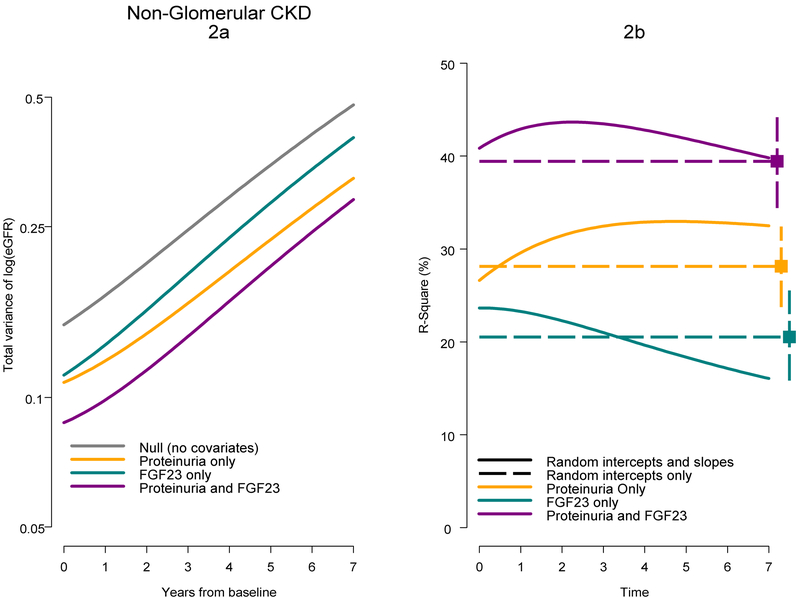
Figure 2.
Total variance and R-square as a function of time for mixed effects models for children with a non-glomerular CKD diagnosis. Figure 2a presents estimates of total eGFR variance for four mixed models in Table 3a. Figure 2b presents time-varying R-square values for mixed models (random intercepts and slopes; Table 2b) and time-constant R-square values based on mixed models with random intercepts only in Table 3.

