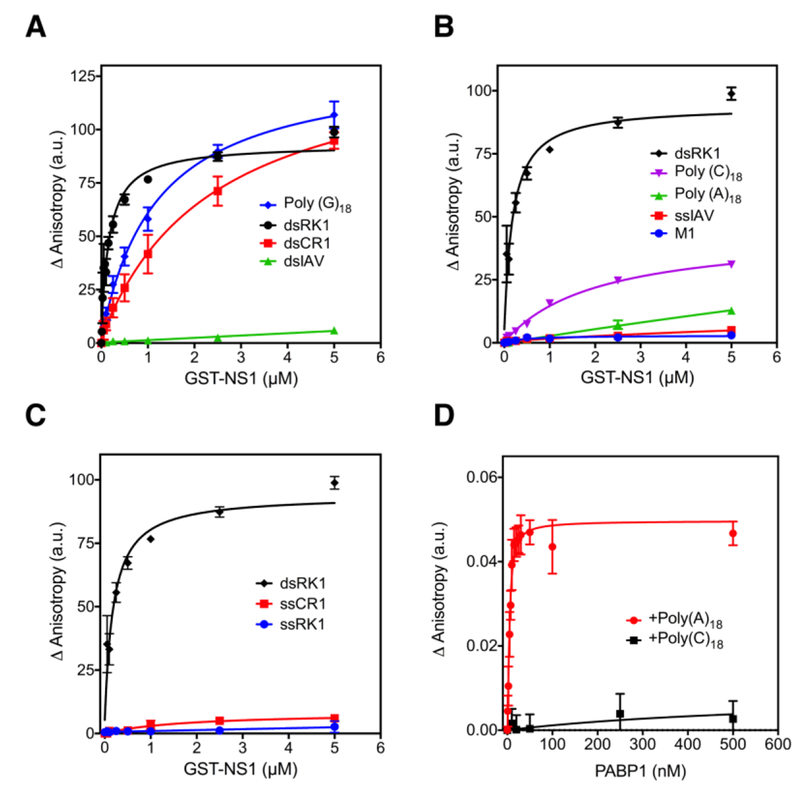
Figure 2. Binding of NS1 and PABP1 to RNA analyzed using a fluorescence anisotropy assay.
(A) Binding of NS1 to dsRK1, dsCR1, dsIAV, and Poly (G)18. (B) Binding of NS1 to dsRK1, Poly (C)18, Poly (A)18, ssIAV, and M1 RNA. (C) Binding of NS1 to dsRK1, ssCR1, and ssRK1. The final concentration of the RNAs was 10 nM, and the final concentration of NS1 was increased from 0 to 5 μM. (D) Binding of PABP1 to Poly (A)18, and Poly (C)18. The final concentration of the RNAs was 5 nM, and the final concentration of PABP1 was increased from 0 to 500 nM. The change in anisotropy is shown on the y-axis. The error bars represent the standard deviation from three independent experiments.

