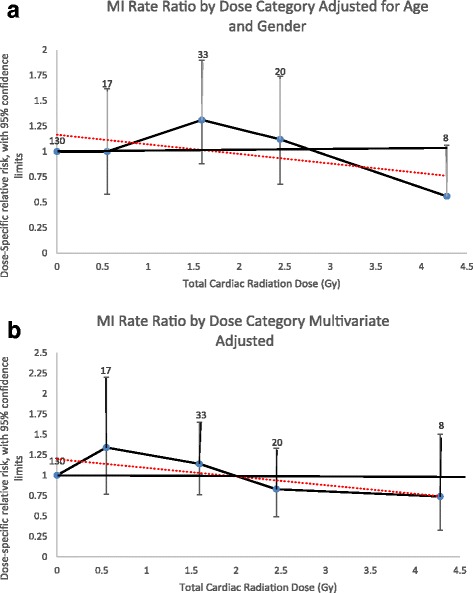
Fig. 1.

Myocardial Infarction Rate Ratios by Radiation Dose Category. a Adjusted for attained age and sex only. b Multivariate adjusted (attained age, sex, diabetes, dyslipidemia, ever smoked, and hypertension). Rate ratios plotted by mean dose of intervals evaluated. Number equals number of events for individuals exposed to that dose category. Dotted line equals linear regression line the slope of which is the ERR/Gy estimate
