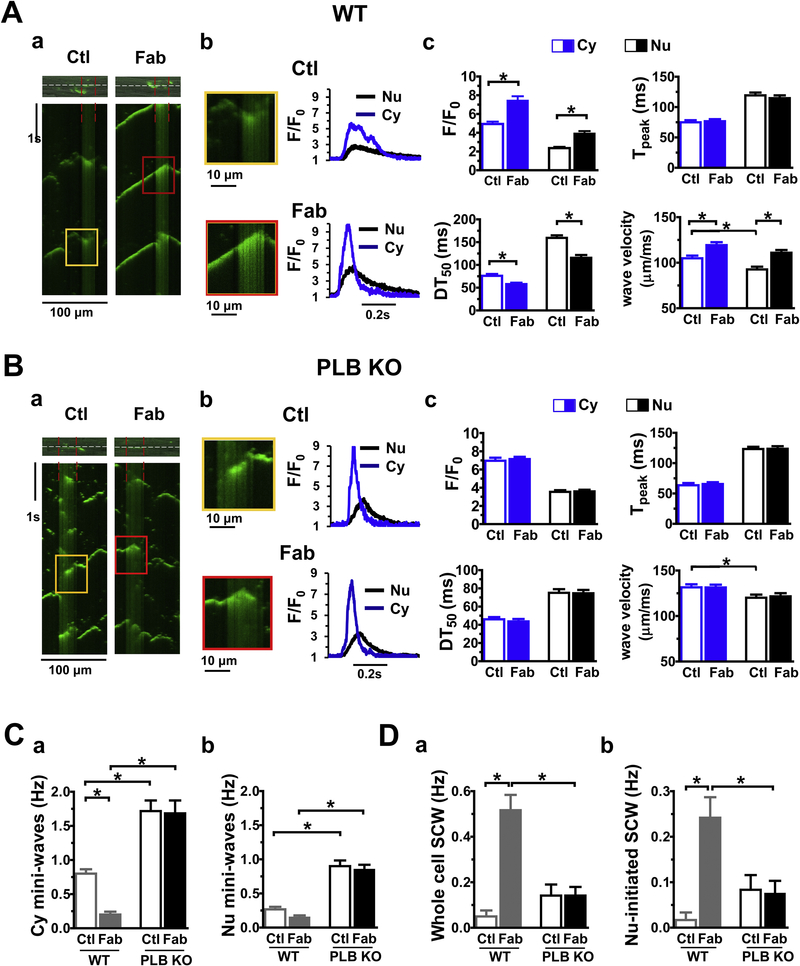
Figure 2. The effect of anti-PLB Fab on initiation of the spontaneous Ca2+ waves in cytoplasmic and perinuclear regions of CMs from WT (A) or PLB-KO mice (B).
a. representative confocal line-scan Ca2+ images using Fluo-4 Ca2+ indicator were obtained in the same permeabilized mouse CM (top) before (Ctl) and after addition of 100 μg/ml anti-PLB Fab (Fab). Nucleus is between red lines. Scan-line (white) is over cytosol and nucleus. Ca2+ concentration was 100 nM. b. Magnified region showing spontaneous Ca2+ waves (SCWs). Traces showed intensity of fluorescent signals (F/F0) of SCWs. c. Bar graphs showing characteristics of SCWs. C, D. Bar graphs showing frequency of mini-waves and long SCWs initiated at cytoplasmic and perinuclear regions. * indicates p<0.05 vs control (average of 12 CMs from 5 WT or 12 CMs from 5 PLB KO mice, respectively).

