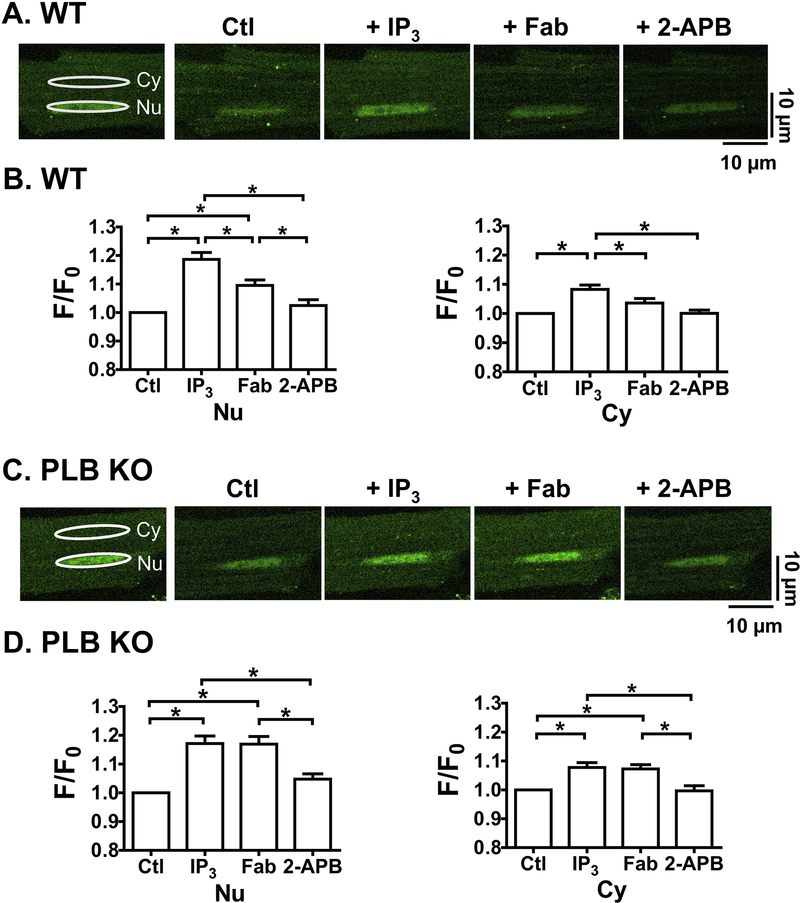
Figure 4. Anti-PLB Fab affects IP3-induced nuclear Ca2+ releases at rest in WT (A, B) but not in PLB-KO (C, D).
Representative 2D confocal images show fluo-4 signals in permeabilized CMs. [Ca2+]I = 10 nM. A.C, Scan Images for nuclear (Nu) and cytosolic (Cy) regions show fluo-4 signals and intensity (F/F0) at control condition (Ctl) and 3 min after sequential addition of IP3 (10 μM), anti-PLB Fab (100μg/ml) and IP3R blocker 2-APB (10 μM). White ellipses show the identical regions of interest for detecting fluorescence intensity in Nu and Cy. B.D, plots show F/F0 at rest for Nu (left panels) and Cy (right panels) in each condition. * indicates p<0.05. n=12 CMs, 6 mice for WT; n= 12 CMs, 6 mice for PLB-KO.

