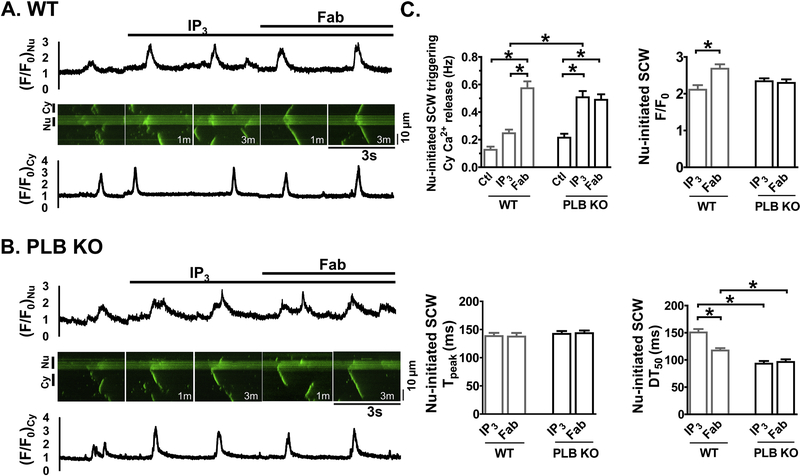
Figure 6. Anti-PLB Fab affects IP3-induced SCWs originated from nuclear regions in WT (A) but not in PLB-KO (B).
Representative line-scan confocal images show fluo-4 signals in permeabilized CMs. </P/> [Ca2+]i,=100nM. A, B. Scan images (3 sec) and traces for cytosolic (Cy, lower panels) and nuclear (Nu, upper panels) regions show fluo-4 signals and intensity profiles (F/F0) at basal (Ctl) and after sequential addition of IP3 (10 μM) and anti-PLB Fab (100μg/ml). M indicates minutes after addition of the reagents. C. Plot shows the frequency and kinetic parameters of nuclear initiated SCWs with triggering cytosolic Ca2+ release. * indicates p<0.05. n=15 CMs, 7 mice for WT; n= 14 CMs, 7 mice for PLB-KO.

