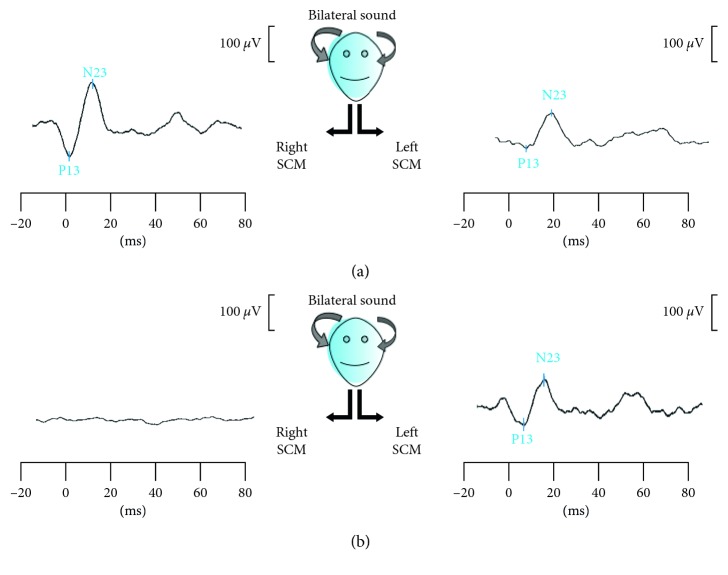
Figure 1.
cVEMP recording in normal (a) and altered (b) conditions. In both (a) and (b) boxes, the two traces correspond, respectively, to right and left SCM muscle potential evoked by bilateral sound stimulation. P13 represents the potential's first peak of positivity, N23 the subsequent peak of negativity. In (a), cVEMPs are present bilaterally; in (b), cVEMP is lost on the right side.

