Figure 2.

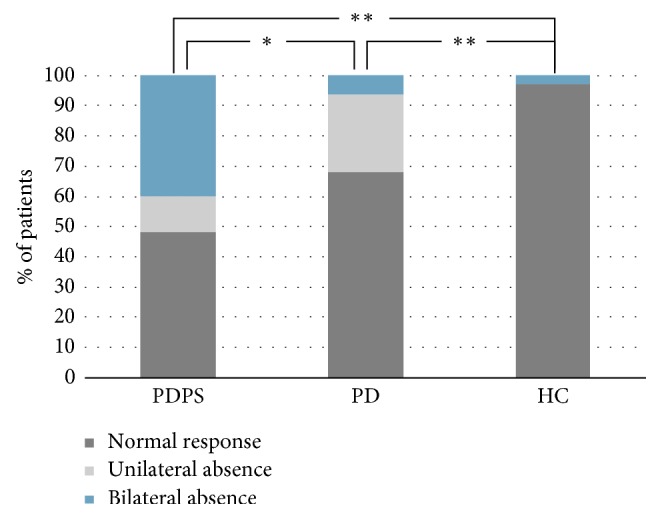
The plot summarizes the percentage of different cVEMPs responses in the three groups. Significance markers (∗ = p < 0.05; ∗∗ = p < 0.001) refer to the presence of “normal responses.” Other data are expressed in the text.

The plot summarizes the percentage of different cVEMPs responses in the three groups. Significance markers (∗ = p < 0.05; ∗∗ = p < 0.001) refer to the presence of “normal responses.” Other data are expressed in the text.