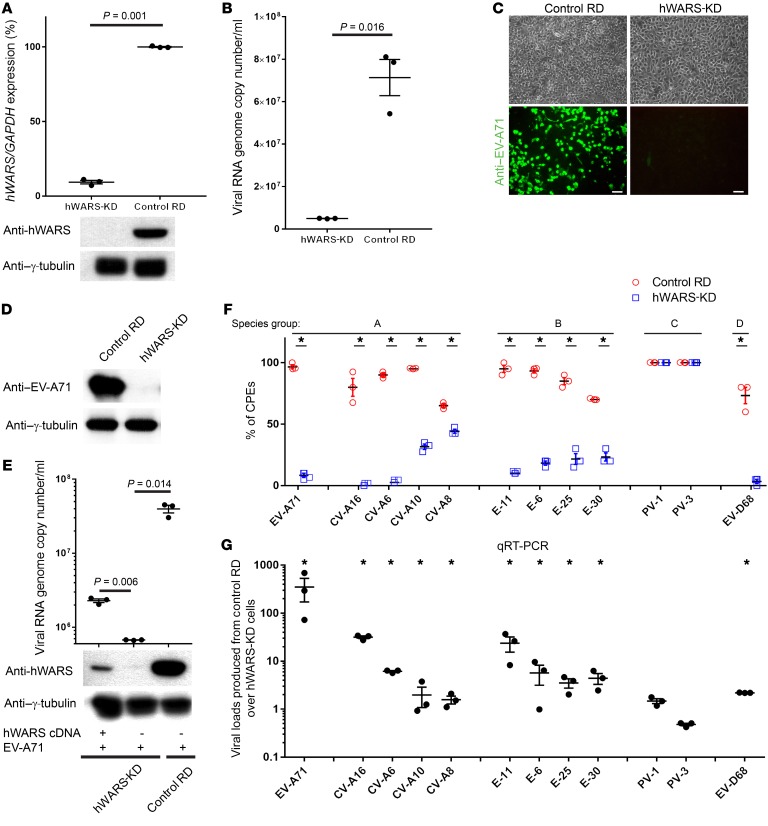
Figure 1. Generation of hWARS-KD cells and requirement of hWARS for EV-A71 infection.
(A) mRNA and protein levels of the hWARS in hWARS-KD cells were measured by qRT-PCR and Western blot analyses. Control shRNA–transfected RD cells were included for comparison. Viral RNA genome copy numbers and EV-A71 protein levels of the EV-A71–infected hWARS-KD and control RD cells were determined by (B) qRT-PCR, (C) immunostaining (scale bars: 100 μm), and (D) Western blot analyses. (E) Transfection of hWARS cDNA (lane 1) or empty vector (lane 2) into hWARS RD cells followed by EV-A71 challenge. Viral RNA genome copy numbers and EV-A71 protein levels of the transfected cells were determined by qRT-PCR and Western blot analyses. EV-A71–infected control RD cells (lane 3) were included for comparison. (F) Differential CPEs of enterovirus serotypes in hWARS-KD and control RD cells. (G) Measurement of viral loads produced from supernatants of control RD cells over that of hWARS-KD cells. Data represent the mean ± SEM. All means were derived from 3 independent experiments. *P < 0.05, by 2-tailed Student’s t test (A, B, F, and G). The significance in E (determined by 2-tailed Student’s t test) for multiple group comparisons has been adjusted to 0.025 by Bonferroni’s correction. Endogenous γ-tubulin was detected as a loading control for all Western blot analyses. Anti–EV-A71 and anti-hWARS antibodies were used to detect EV-A71 and hWARS proteins. Data in A, C, D, and E are representative of 3 independent experiments.

