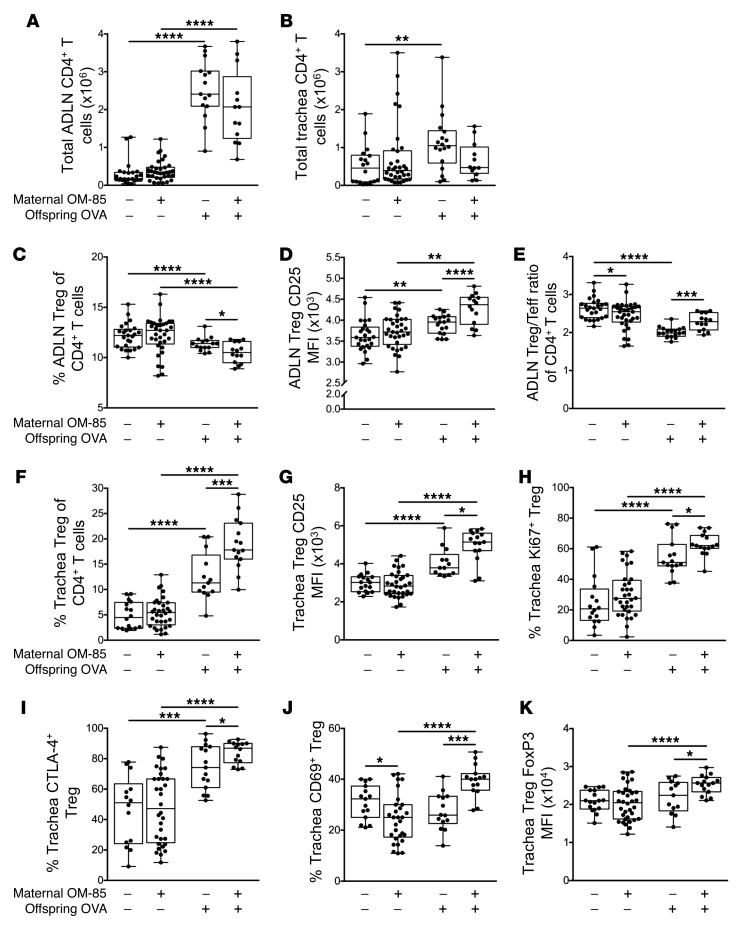
Figure 4. Maternal OM-85 treatment during pregnancy promotes Treg suppressive phenotypes in sensitized and challenged offspring.
(A and B) Absolute numbers of CD3+CD4+CD8– T cells in (A) ADLNs and (B) trachea. (C–E) Analysis of Tregs within ADLNs showing (C) Tregs as a proportion of total CD4+ T cells, (D) MFI of CD25 on Tregs, and (E) Treg/Teff ratio within total CD4+ T cells. (F–J) Analysis of Tregs in the trachea showing (F) Tregs as a proportion of total CD4+ T cells, (G) MFI of CD25 on Tregs, (H) the proportion of Ki67+ Tregs, (I) the proportion of CTLA-4+ Tregs, and (J) the proportion of CD69+ Tregs. (K) MFI of FoxP3 on tracheal Tregs. Data are from individual animals and compare naive controls versus OVA-sensitized and aerosol-challenged offspring from OM-85–treated and untreated mothers. Data are displayed as box-and-whisker plots showing median, Q1, and Q3 and minimum to maximum values of n ≥ 9 independent experiments. Statistical significance was determined using Student’s t test or Mann-Whitney U test and is presented as *P < 0.05, **P < 0.01, ***P < 0.001, ****P < 0.0001.

