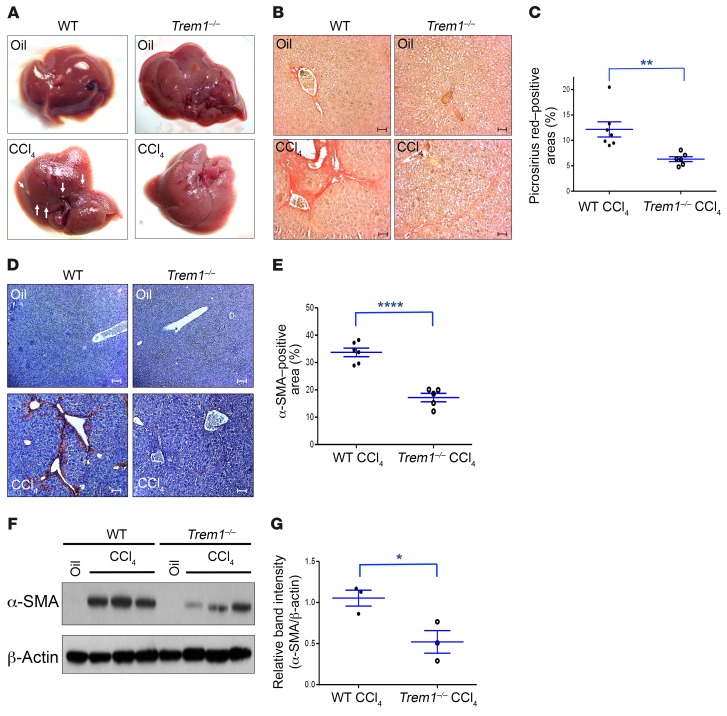
Figure 1. Deletion of Trem1 attenuates hepatic fibrogenesis.
(A) Representative macroscopic images of livers from WT and Trem1–/– control mice (oil-injected, n = 3/group, top) and WT and Trem1–/– mice treated with 12 injections of CCl4 over a 6-week period (n = 6–7/group, bottom). Arrowheads indicate fibrotic nodules visible on CCl4-treated WT mice. (B) Collagen deposition was evaluated with Picrosirius red staining. Representative images of liver sections from WT and Trem1–/– control mice (n = 3/group, top) and from WT and Trem1–/– mice treated with CCl4 (n = 6–7/group, bottom). Original magnification, ×20; scale bars: 50 μm. (C) Quantification (percentage) of Picrosirius red–positive areas. (D) Representative images of liver sections from WT and Trem1–/– control mice (n = 3/group, top) and from WT and Trem1–/– mice treated with CCl4 (n = 5–6/group, bottom) stained with anti–α-SMA antibody. Original magnification, ×10; scale bars: 100 μm. (E) Quantification of α-SMA–positive areas (percentage). (F) Immunoblot analysis of α-SMA in liver lysates from the indicated mice (n = 3/group). β-Actin was used as a loading control. The full, uncut gels are shown in the supplemental material. (G) Quantification of α-SMA expression (n = 3 mice/group). Results are displayed as the mean ± SEM. *P < 0.05, **P < 0.01, and ****P < 0.0001, by 2-tailed Student’s t test (C, E, and G). Experiments shown in A, B, and D are representative of 2 independent experiments.

