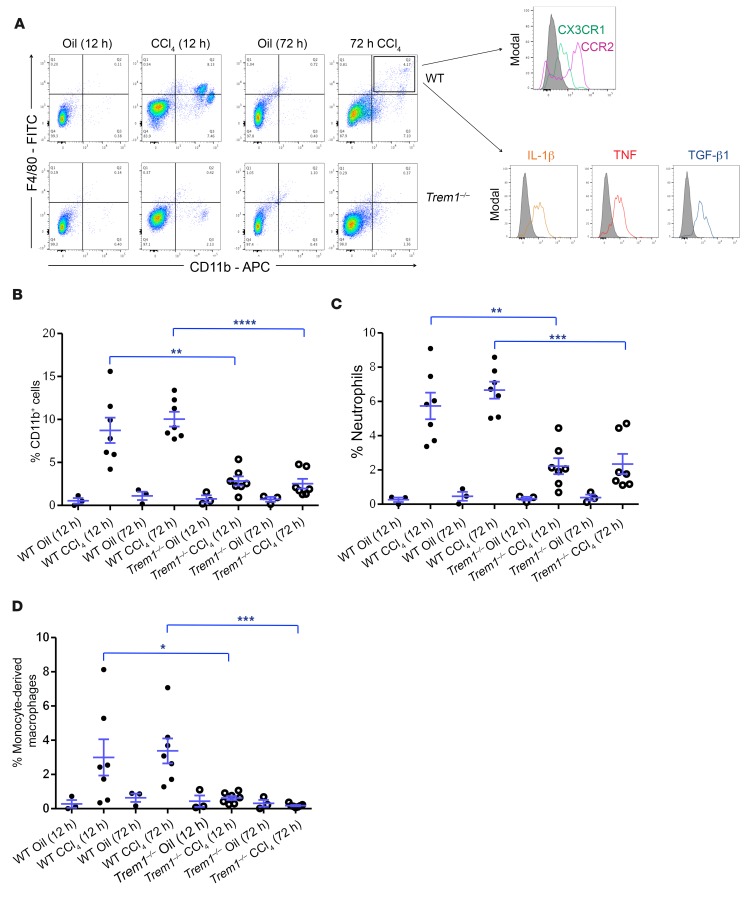
Figure 5. Deletion of Trem1 reduces inflammatory cell infiltration at early stages of liver fibrogenesis.
(A) Flow cytometric dot plots of liver cells from control WT and Trem1–/– mice (oil-injected, n = 3/group) and WT and Trem1–/– mice 12 hours and 72 hours after CCl4 injury (n = 7 mice/time point/group). Cells were stained with anti-F4/80, anti-CD11b, anti-CCR2, anti-CX3CR1, anti–IL-1β, anti-TNF, and anti–TGF-β1 antibodies. Liver cells from WT mice were stained and analyzed 72 hours after CCl4 injection for the expression of CCR2 and CX3CR1 (n = 5 mice) and for the intracellular expression of IL-1β, TNF, and TGF-β1 (n = 7 mice). Flow cytometric histograms represent cells gated on a F4/80+CD11b+ population. Control staining was performed with IgG isotype (gray histograms). (B–D) Percentage of CD11b+ cells, neutrophils, and inflammatory monocyte–derived macrophages in liver from WT and Trem1–/– mice quantified after 12 hours and 72 hours of oil injection (n = 3 mice/time point/group) or CCl4 treatment (n = 7 mice/time point/group). Results are displayed as the mean ± SEM. *P < 0.05, **P < 0.01, ***P < 0.001, and ****P < 0.0001, by 2-tailed Student’s t test (B, C, and D).

