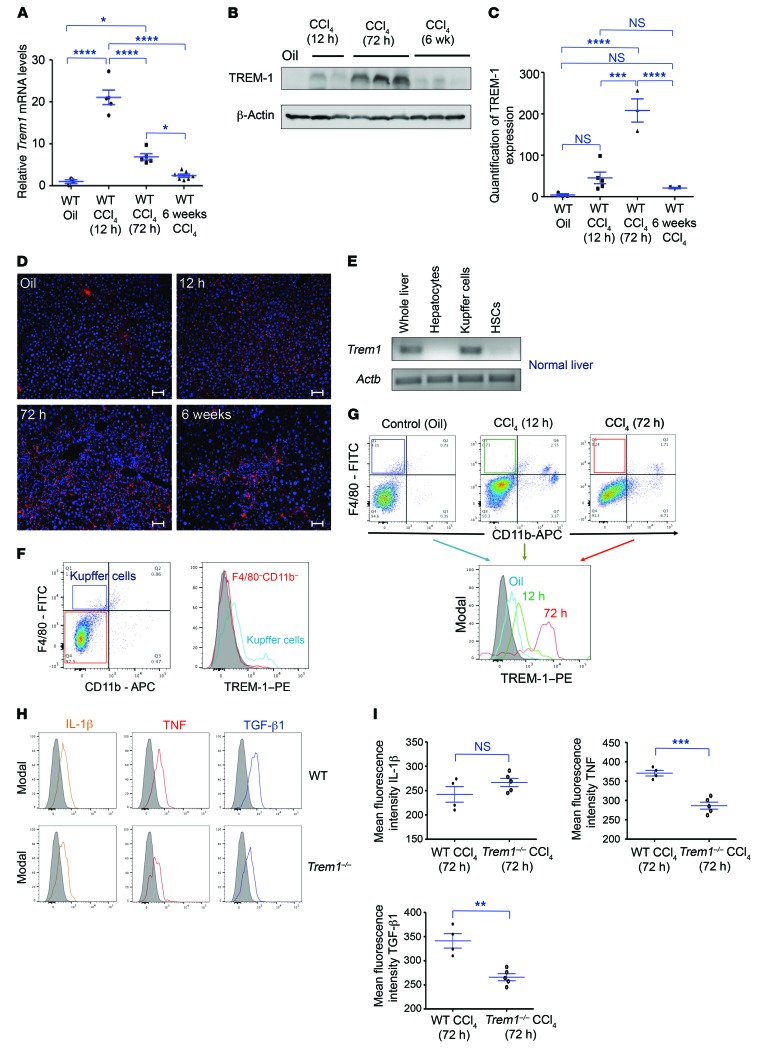
Figure 6. Expression of Trem1 in liver during fibrogenesis.
(A) WT mice were treated with oil (control, n = 3) or a single dose of CCl4 and analyzed after 12 hours and 72 hours (n = 5 mice/time point). Another group of WT mice was treated with 12 injections of CCl4 and analyzed after 6 weeks (n = 7 mice). mRNA levels of Trem1 in liver were assessed by RT-qPCR. Expression was normalized to the average of 3 different control genes (Actb, Gapdh, and Hprt1) and is represented as the fold induction. (B) Representative immunoblot analysis for TREM-1 in WT mouse liver lysates at different time points. β-Actin was used as a loading control. The full, uncut gels are shown in the supplemental material. (C) Quantification of TREM-1 expression in liver from WT control mice (n = 3) and CCl4-treated mice at 12 hours (n = 5), 72 hours (n = 3), and 6 weeks (n = 3). (D) Representative phycoerythrin-conjugated (PE-conjugated) anti–TREM-1 antibody–stained immunofluorescence images of liver sections from WT control oil-injected mice (n = 3, top) and CCl4-treated mice at 12 hours (top), 72 hours, and 6 weeks (n = 5–7 mice/time point/group, bottom). Original magnification, ×20; scale bars: 50 μm. Images are representative of 2 independent experiments. (E) RT-qPCR was performed to assess Trem1 mRNA expression in whole liver as well as in purified hepatocyte, Kupffer cell, and HSC fractions from WT mice (n = 3 mice/cell fraction). (F) Flow cytometric dot plots of WT control mouse liver cells (n = 9 mice) stained with anti-F4/80 and anti-CD11b antibodies. Flow cytometric histograms represent TREM-1 expression on a gated F4/80–CD11b– cell population and on gated F4/80+CD11b– Kupffer cells (n = 9 mice). Control staining was performed with IgG isotype (gray histogram). (G) Flow cytometric dot plots and histograms of TREM-1 expression on gated F4/80+CD11b– Kupffer cells isolated from oil-injected WT control mice (n = 9) and from mice treated with CCl4 (n = 7 mice/time point/group) for 12 hours and 72 hours. Control staining was performed with IgG isotype (gray histogram). (H) Flow cytometric histograms of intracellular expression of IL-1β, TNF, and TGF-β1 on gated F4/80+CD11b– Kupffer cells from CCl4-injured (72 h) WT (n = 4) and Trem1–/– (n = 5) mice. Control staining was performed with IgG isotype (gray histograms). (I) Quantification of mean fluorescence intensity of the indicated cytokines. Results are displayed as the mean ± SEM. *P < 0.05, **P < 0.01, ***P < 0.001, and ****P < 0.0001, by ANOVA followed by Bonferroni’s post hoc test (A and C) and 2-tailed Student’s t test (I).

