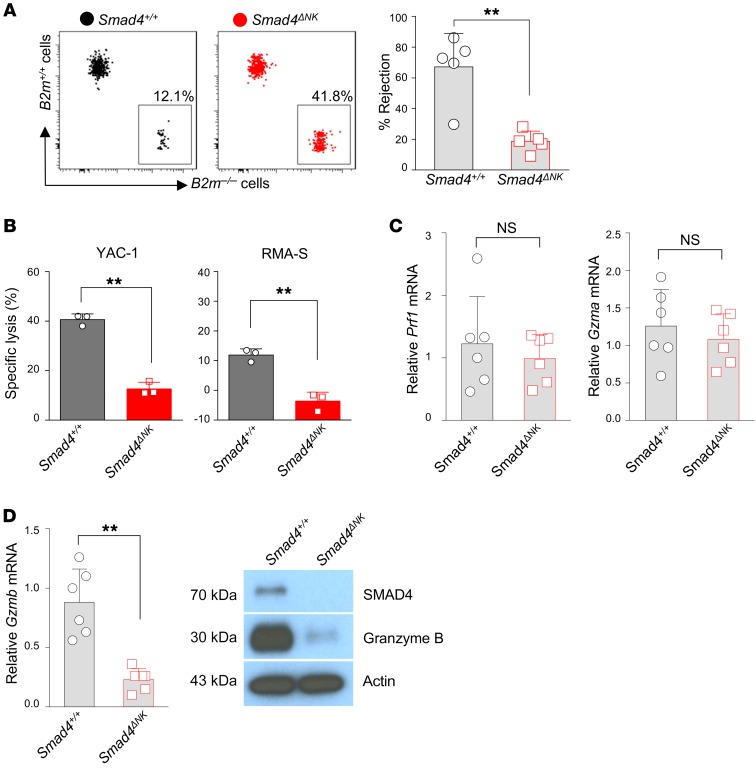
Figure 2. Impaired rejection of B2m–/– target cells and decreased Gzmb in Smad4-deficient NK cells.
(A) Representative flow cytometric data showing relative B2m–/– and B2m+/+ donor splenocyte rejection by Smad4+/+ and Smad4ΔNK recipient mice. The graph shows summary data of rejection percentages of B2m–/– donor splenocytes by Smad4+/+ and Smad4ΔNK recipient mice calculated using the formula described in Methods (n = 5). Data are presented as the mean ± SD. Differences between littermates were evaluated. **P < 0.01, by 2-tailed, paired t test. The circles and squares on the bar graphs denote data for individual mice. (B) Ex vivo cytotoxicity analysis of NK cells from Smad4+/+ and Smad4ΔNK mice. Effector/target = 50:1 (n = 3). **P < 0.01, by 2-tailed, unpaired t test. (C) Real-time RT-PCR analysis of Prf1 and Gzma mRNA expression in NK cells (n = 6). Data are presented as the mean ± SD. Differences between littermates were evaluated. Statistical analysis was conducted using a 2-tailed, paired t test. The circles and squares on bar graphs denote data for individual mice. (D) Real-time RT-PCR and immunoblot analysis of Gzmb expression in NK cells. Data are presented as the mean ± SD. Differences between littermates were evaluated. **P < 0.01, by 2-tailed, paired t test. The circles and squares on the bar graphs denote data for individual mice.

