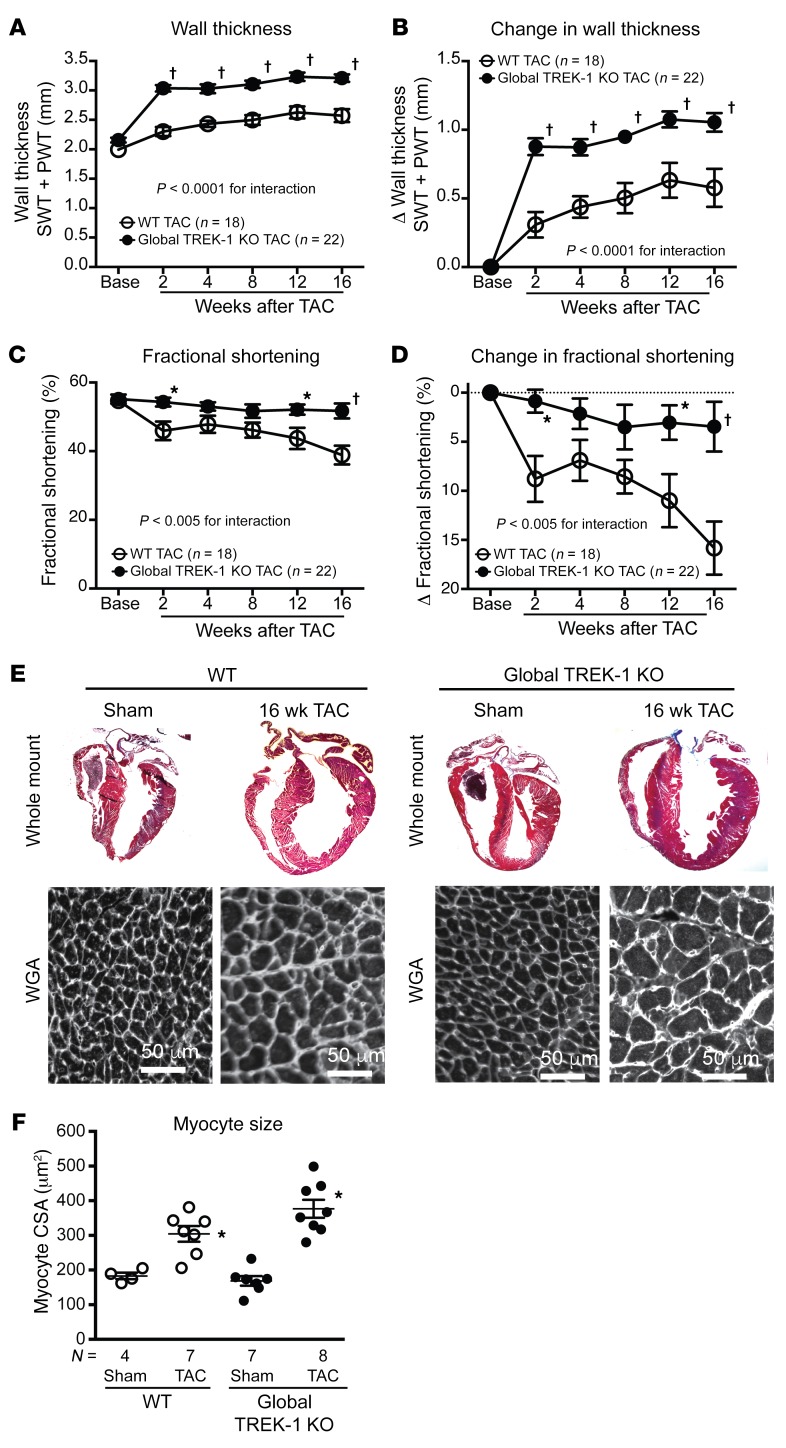
Figure 2. Global TREK-1 KO develops hypertrophy and maintains function after pressure overload.
(A) Serial echocardiographic measurements of average wall thicknesses (SWT + PWT) and (B) average change in wall thickness, (C) average FS ([EDD – ESD/EDD] × 100) and (D) average change in FS in TREK-1 KO and WT at baseline and up to 16 weeks after TAC. Error bars reflect SEM. Statistical comparisons between WT TAC and TREK-1–KO TAC data were made using 2-way repeated measures ANOVA. P values for the interaction between genotype and weeks after TAC are shown. Comparisons between genotypes at each time point were made using Bonferroni’s test for multiple comparisons. †P < 0.001; *P < 0.05 for WT TAC versus TREK-1–KO TAC at each time point. (E) Whole mount of hearts from WT and TREK-1–KO hearts both under sham and 16 weeks of TAC conditions. Representative wheat germ agglutinin (WGA) staining showing myocyte areas in WT and TREK-1 KO 16 weeks following sham or TAC. Scale bars: 50 μm. (F) Average myocyte cross-sectional area (CSA) in WT and TREK-1–KO cross-sectional area after 16 weeks of TAC. The average measured CSAs of 300–500 cardiomyocytes were used for each animal. Statistical comparisons were performed using 1-way ANOVA with Newman-Keuls test for multiple comparisons. *P < 0.05 versus WT sham.

