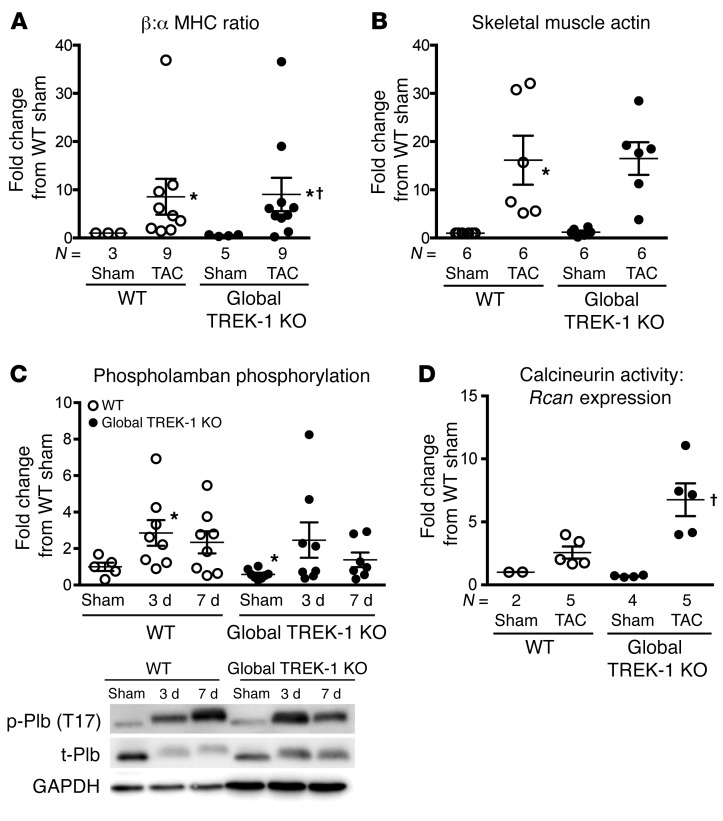
Figure 3. Global TREK-1 KO develops hypertrophic molecular signatures after pressure overload.
(A) Average β-MHC to α-MHC ratio and (B) skeletal muscle actin gene expression in LVs after 2 weeks of TAC. For gene expression studies in panels A and B, statistical comparisons with WT sham, which has a theoretical mean of 1, were made with a 1-sample, 2-tailed t test. *P < 0.05 versus WT sham. Comparisons among all other groups excluding WT sham were made using by Kruskal-Wallis test with Dunn’s multiple comparisons test. †P < 0.05 versus TREK-1 KO sham. (C) CaMKII activity, as measured by phosphorylated phospholamban at threonine 17. Densitometry quantification of the ratio of phosphorylated phospholamban to total phospholamban, normalized to WT sham condition. Full, uncut gels are shown in the supplemental material. (D) Calcineurin activity as measured by RCAN1 gene expression from cDNA obtained from WT and TREK-1–KO LVs after sham or TAC. For the phospholamban (shown in C) and calcineurin experiments (shown D), statistical comparisons with WT sham, which has a theoretical mean of 1, were made with a 1-sample, 2-tailed t test. *P < 0.05 versus WT sham. Comparisons among all other groups excluding WT sham were made using by Kruskal-Wallis test with Dunn’s multiple comparisons test. †P < 0.05 versus WT TAC.

