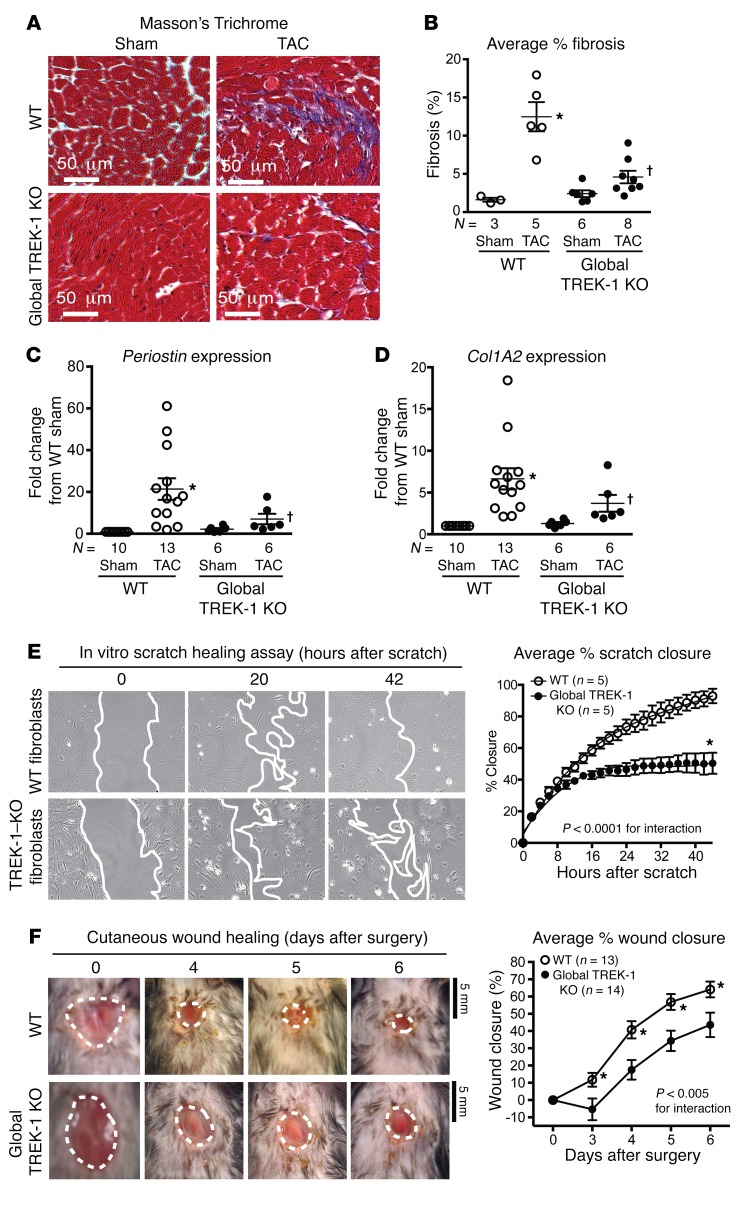
Figure 5. TREK-1 regulates both cardiac and extracardiac fibrosis.
(A) Representative Masson’s trichrome staining with fibrosis shown in purple. (B) Average percentage fibrosis after 16 weeks of TAC. *P < 0.05 versus control sham using 1-sample, 2-tailed t test. †P < 0.05 versus WT TAC by Kruskal-Wallis test with Dunn’s multiple comparisons test. (C) Average Periostin and (D) collagen type I A2 (Col1A2) gene expression in LVs after 2 weeks of TAC. Statistical comparisons with WT sham, which has a theoretical mean of 1, were made with a 1-sample, 2-tailed t test. *P < 0.05 versus WT sham. Comparisons among all groups excluding WT sham were made by Kruskal-Wallis test with Dunn’s multiple comparisons test. †P < 0.05 versus WT TAC. (E) Average percentage closure of in vitro scratch closure in WT and TREK-1–KO isolated fibroblasts over 44 hours (n = 5 separate experiments). Representative images included below, with leading edge marked in white. Data were compared using 2-way repeated measures ANOVA. *P < 0.05 in comparison with WT of the same time point using Bonferroni’s correction. (F) Average percentage of cutaneous wound closure in control and TREK-1 KO in 6-day wound-healing protocol (WT, n = 13; TREK-1 KO, n = 14). Representative tracings of wound size were included below. Statistical comparisons between the curves were performed using 2-way repeated measures ANOVA. Scale bars: 5 mm. *P < 0.05 in comparison with TREK-1 KO of the same time point using Bonferroni’s correction.

