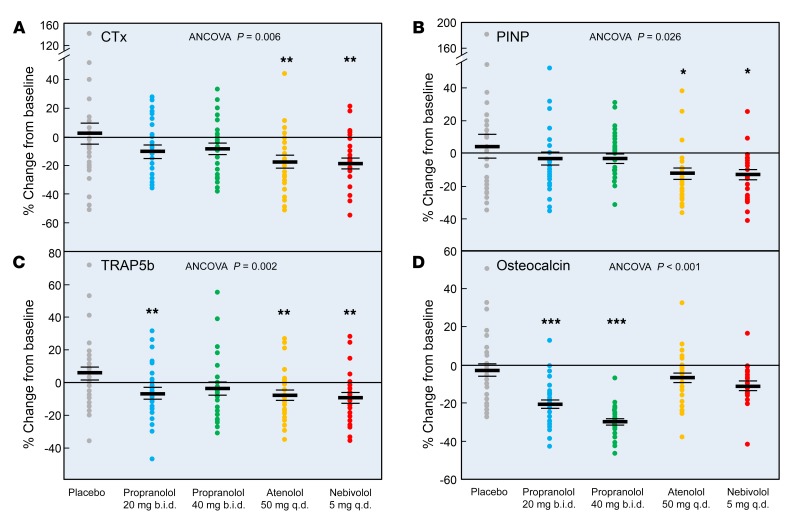
Figure 3. Percentage of change from baseline in bone resorption and bone formation markers in the study subjects following the assigned treatments.
Percentage of change from baseline after 20 weeks of treatment in serum levels of (A) CTx, (B) PINP, (C) TRAP5b, and (D) osteocalcin. ANCOVA P values are indicated, and when these were less than 0.05, individual groups were compared with the placebo-treated group using the Dunnett’s 2-tailed t test. *P < 0.05, **P < 0.01, and ***P < 0.001. As per the CONSORT flow diagram in Figure 2, the sample sizes for the week-20 analyses were as follows: placebo, n = 29; propranolol 20 mg b.i.d., n = 26; propranolol 40 mg b.i.d., n = 25; atenolol 50 mg/day, n = 25; and nebivolol 5 mg/day, n = 24.

