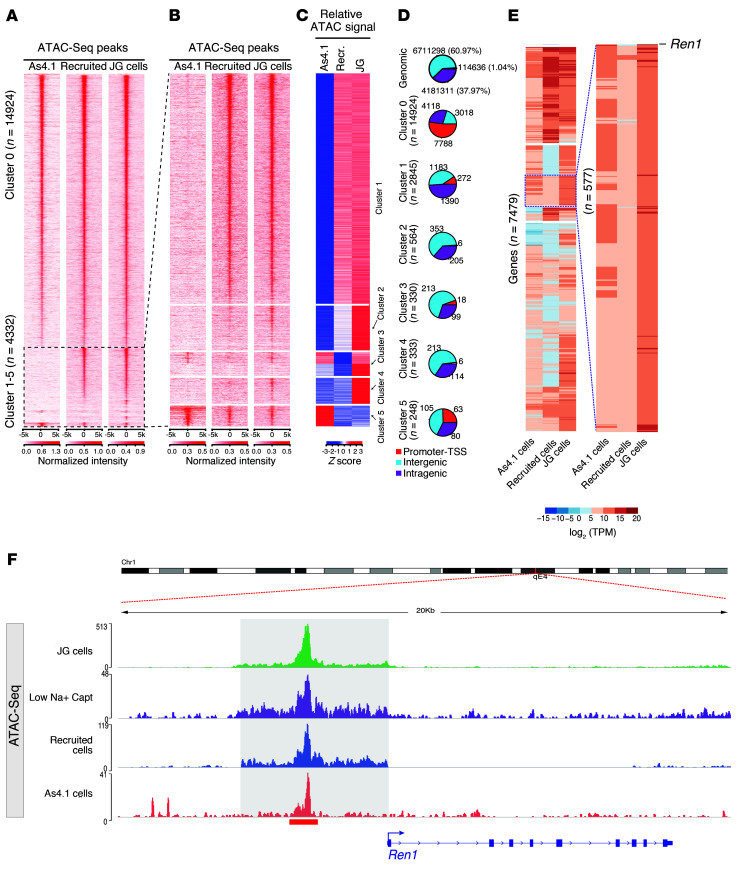
Figure 2. Comparative analysis of chromatin states across renin cell types.
(A and B) Heatmaps depict the sequencing read coverage intensity at 19,256 consensus ATAC-Seq peaks. Each row represents the DNA accessibility profile of a regulatory element demonstrating significant ATAC-Seq signal intensity. While cluster 0 shows ATAC-Seq and H3K27ac ChIP-Seq (Supplemental Figure 1A) peaks that are shared by the 3 cell types, clusters 1–5 demonstrate cell type–specific differential distributions and ATAC-Seq reads (B) at 5 kb upstream and downstream of each of the ATAC-Seq peaks. (C) Read coverage intensities at cell type–specific ATAC-Seq peaks: cluster 1 and 2 show ATAC-Seq peaks observed in mouse isolated cell types; cluster 3 shows ATAC-Seq peaks shared by As4.1 cell line and in JG cells; cluster 4 shows specific peaks in JG cells; cluster 5 shows specific ATAC-Seq peaks in As4.1 cells. Normalized ATAC-Seq signal intensities (Z scores) at peaks in clusters 1–5 to highlight the relative cell type–specific ATAC-Seq signal. (D) Pie charts show proportions of ATAC-Seq peaks in each cluster in the indicated genomic compartments. Promoter regions are defined as 1,000 bp upstream to 100 bp downstream of the transcription start site (TSS), intragenic regions are defined as introns, exons, 5′ UTR, 3′ UTR, and TTS, and the rest of the genome is defined as the intergenic regions. Genomic control sites are defined as all the sites in the genome with bins equivalent to the median ATAC peak size and a sliding window of half that size. (E) Expression levels for genes associated to ATAC-Seq peaks in cluster 0 shown in B. The inset to the right shows the renin gene with notable differences in its expression between the 3 cell types. (F) Genome browser image at the renin locus shows a remarkably similar pattern of ATAC-Seq among the renin cell types.

