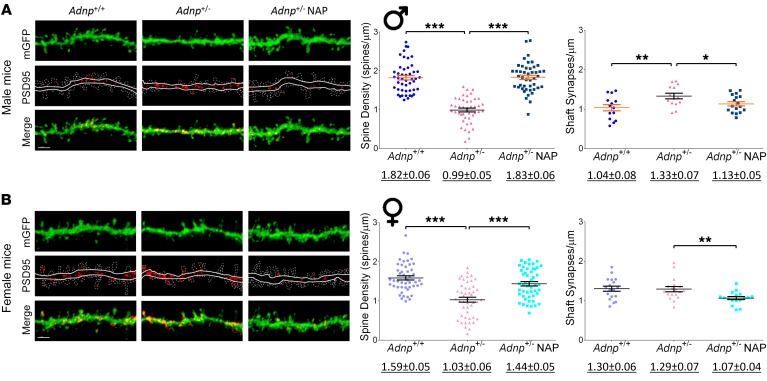
Figure 2. Adnp+/– mice, compared with Adnp+/+ mice, display significantly decreased cortical dendritic spine density that is ameliorated by NAP.
Average total spine density (males: Adnp+/+ n = 47, Adnp+/– n = 43, Adnp+/– NAP, n = 45; females: Adnp+/+ n = 47, Adnp+/– n = 47, Adnp+/– NAP, n = 49 dendrites/experimental group) and shaft synapse density (males: Adnp+/+ n = 14, Adnp+/– n = 14, Adnp+/– NAP, n = 17; females: Adnp+/+ n = 18, Adnp+/– n = 18, Adnp+/– NAP, n = 17 dendrites/experimental group). Total spine density was significantly decreased in both male and female Adnp+/– mice, with NAP significantly increasing spine density. Shaft synapse density was significantly increased in males and reduced by NAP in both sexes. A 2-way ANOVA with Tukey’s post hoc test was performed. Underlined numbers beneath the graphs represent the mean ± SEM. (A) In male mice, for total spine density, main genotype [F(1,178) = 26.892, P < 0.001], treatment [F(1,178) = 29.250, P = 0.001], and interaction [F(1,178) = 82.876, P < 0.001] effects were found. For shaft synapses, main genotype [F(1,55) = 5.967, P = 0.018)] and interaction [F(1,55) = 5.769, P = 0.020] effects were found. Tukey’s post hoc test revealed significant differences between Adnp+/+ and Adnp+/– mice (**P < 0.01 and ***P < 0.001) and between NAP- and vehicle-treated Adnp+/– mice (*P < 0.05 and ***P < 0.001). (B) In female mice, for total spine density, main genotype [F(1,188) = 53.088, P < 0.001], treatment [F(1,188) = 22.105, P < 0.001], and interaction [F(1,188) = 5.506, P = 0.020] effects were found. For shaft synapses, a main treatment effect was found [F(1,67) = 12.743, P < 0.001]. Tukey’s post hoc test revealed significant differences between Adnp+/+ and Adnp+/– mice (***P < 0.001) and between NAP- and vehicle-treated Adnp+/– mice (**P < 0.01). (A and B) Adnp+/+ data are reshown in Supplemental Figure 2, A and B. Scale bars: 2 μm.

