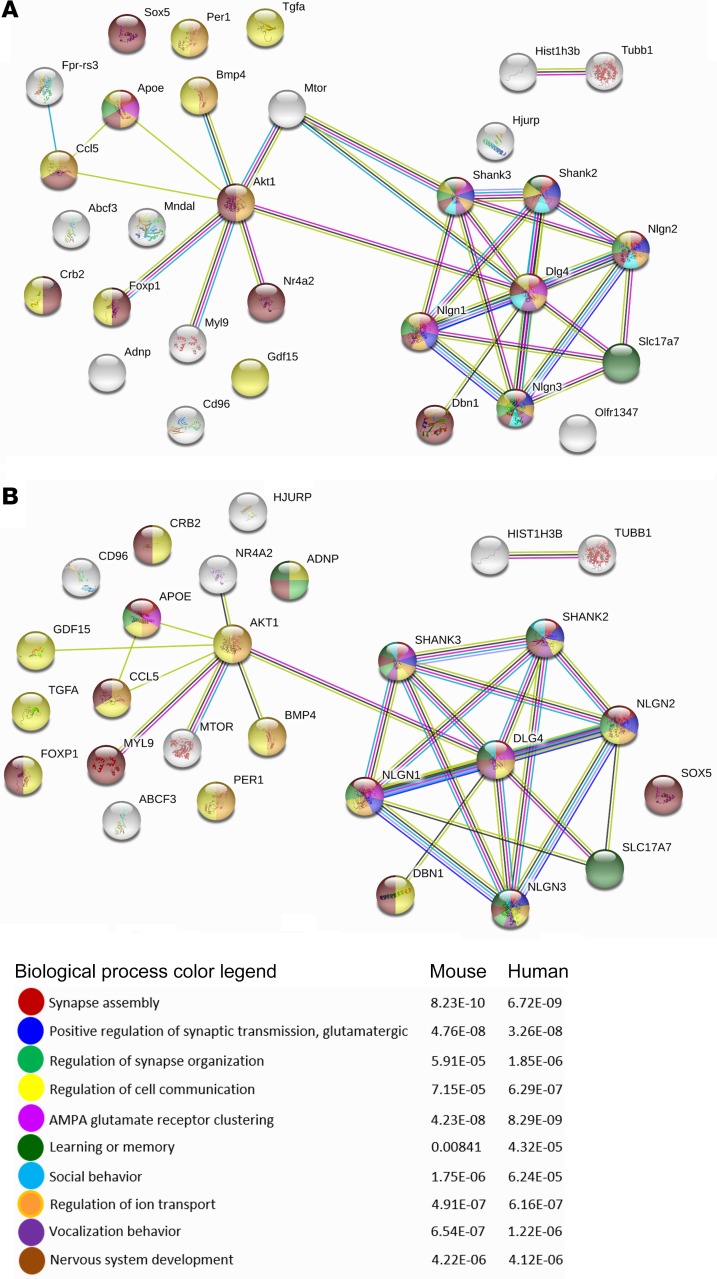
Figure 3. Function enrichment and network analysis of genes regulated by genotype and drug treatment.
STRING protein-protein interaction network (77) (https://string-db.org) analysis was performed for common genes listed in Supplemental Table 5 and Supplemental Table 8 representing shared transcripts that changed as a consequence of genotype or NAP treatment in 19- to 27-day-old and 3-month-old mice, compared with either the mouse (A) or human (B) database. Enriched biological processes are marked on the network according to the color legend.

