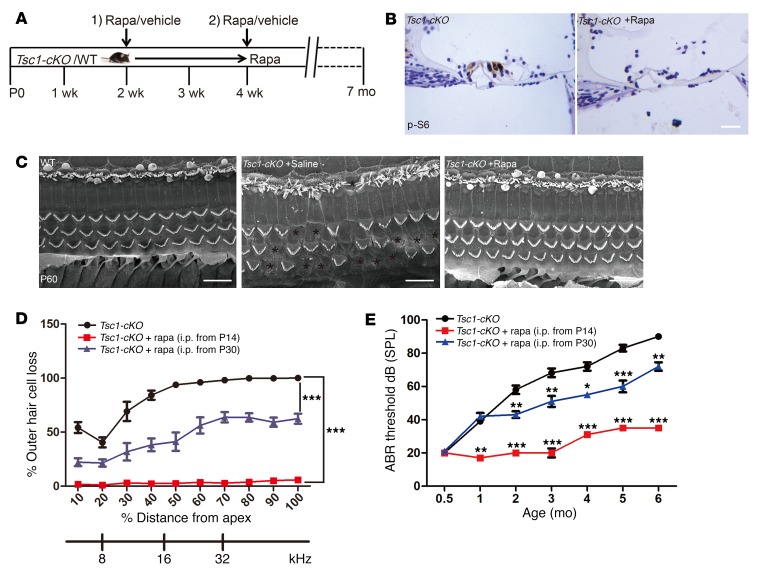
Figure 8. Rapamycin treatment prevents the hearing loss phenotype in Tsc1-cKO mice.
(A) Schematic of rapamycin treatment (1 mg/kg i.p. every other day) to examine its effects on hearing in Tsc1-cKO mice. (B) Immunohistochemistry to detect p-S6 and hematoxylin staining of cochlear sections from Tsc1-cKO mice treated with or without rapamycin. n = 3. Scale bar: 20 μm. (C) SEM images showed that many hair cells disappeared in the middle turn of the cochlea in Tsc1-cKO mice; however, there were no obvious differences between Tsc1-cKO mice injected with rapamycin and WT control mice. n = 3. Scale bars: 10 μm. (D) Cochleograms of Tsc1-cKO mice (n = 8), Tsc1-cKO mice treated with rapamycin starting at P14 (n = 10), and Tsc1-cKO mice treated with rapamycin starting at P30 (n = 10). The cochleograms were recorded in the mice at 5 months of age. Graph shows the percentage loss of OHCs as a function of percentage distance from the apex. (E) Age-related click ABR hearing threshold results for Tsc1-cKO mice (n = 8), Tsc1-cKO mice treated with rapamycin starting at P14 (n = 10), and Tsc1-cKO mice treated with rapamycin starting at P30 (n = 10) at the same time points. Data represent the mean ± SEM. *P < 0.05, **P < 0.01, ***P < 0.001, by 2-tailed Student’s t test or 1-way ANOVA with Holm-Šidák multiple-comparisons test.

