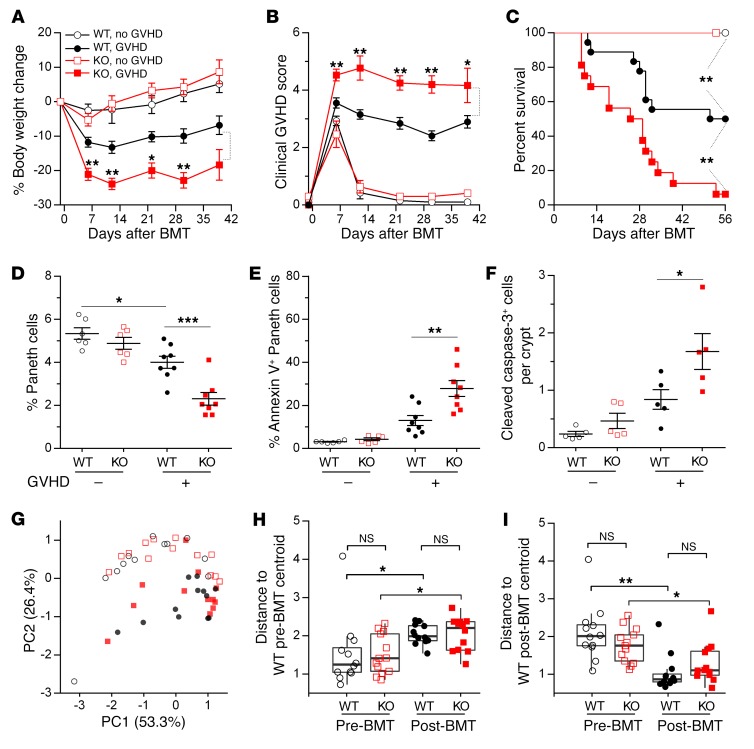
Figure 4. REG3γ absence increases GVHD severity.
WT B6 and B6-Reg3g–/– (KO) mice underwent BMT from B6-Ly5.1 donors (GVHD –: WT, white circles; KO, white squares) or C3H.SW donors (GVHD +: WT, black circles; KO, red squares). (A–C) Serial body weight measurement (A), clinical GVHD score (B), and survival (C) of mice after BMT (WT, white circles, n = 7; KO, white squares, n = 7; WT, black circles, n = 18; KO, red squares, n = 16). (D–F) On day +7 after BMT, WT or KO recipients (Lgr5-EGFP+) were euthanized. Small intestine crypt cells were isolated and analyzed by flow cytometry. Small intestine sections were stained by immunochemistry. (D and E) Quantification of Paneth cells (D) and quantification of Paneth cells undergoing early apoptosis by annexin V+ staining (E) (WT, white circles, n = 6; KO, white squares, n = 6; WT, black circles, n = 8; KO, red squares, n = 8). (F) Quantification of cleaved caspase-3+ cells per crypt of ileum sections in recipients (each group, n = 5). *P < 0.05, **P < 0.01, ***P < 0.001, unpaired 2-tailed t test (A, B, and D–F); **P < 0.01, log-rank test (C). Data are expressed as mean ± SEM. (G–I) Microbiome composition of fecal samples from WT and KO mice 1 day before BMT (Pre-BMT) (WT, white circles, n = 12; KO, white squares, n = 13) or day +7 after BMT (Post-BMT) (WT, black circles, n = 12; KO, red squares, n = 13). (G) Principal component analysis was computed from the Bray-Curtis β-diversity matrix among all samples. (H and I) Bray-Curtis compositional distances were measured from the centroid of WT pre-BMT samples (H) or post-BMT samples (I). NS, P > 0.05; *P < 0.05, **P < 0.01, Wilcox test.

