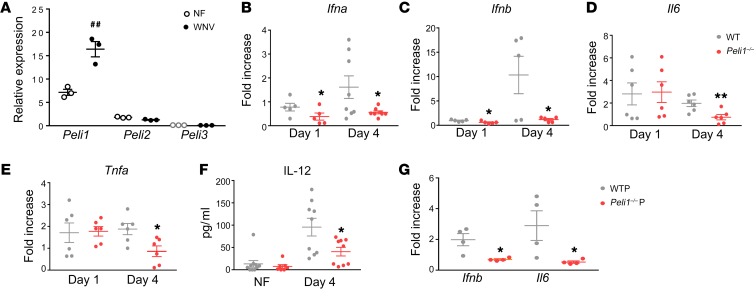
Figure 3. WNV-induced antiviral immune responses in WT and Peli1–/– macrophages.
(A–F) WT and Peli1–/– macrophages were infected with WNV and harvested at the indicated time points. (A) Peli1, Peli2, and Peli3 RNA levels in WT macrophages were measured on day 4 p.i. Data are representative of 3 similar experiments and are presented as the mean ± SEM (n = 3). ##P < 0.01 compared with the noninfected group (unpaired, 2-tailed Student’s t test). (B–F) Cytokine RNA or protein levels were measured at the indicated time points by qPCR or Bio-Plex, respectively. Data represent the mean ± SEM of 5 to 10 samples collected from 2 independent experiments. *P < 0.05 and **P < 0.01 compared with the WT group. (G) WT macrophages were infected at a MOI of 0.02 with WNV passaged in WT or Peli1–/– macrophages. On day 4 p.i., cytokine production was determined by qPCR. Data are presented as the fold increase compared with mock-infected cells (mean ± SEM) and are representative of 2 similar experiments (n = 4 per group). *P < 0.05 compared with the WTP group (unpaired, 2-tailed Student’s t test).

