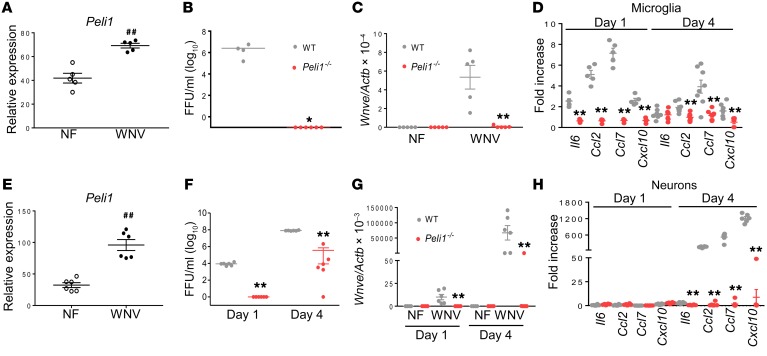
Figure 5. WNV infection and induction of immune responses in microglia and neurons.
(A) RNA levels of Peli1 in WT microglia on day 4 p.i. were determined by qPCR. Data are presented as the mean ± SEM and are representative of 2 independent experiments (n = 5). ##P < 0.01 compared with the noninfected group (unpaired, 2-tailed Student’s t test). (B–D) Primary microglia were infected with WNV 385-99 and harvested at the indicated time points. Data are presented as the mean ± SEM of 4 to 8 pooled samples from 2 independent experiments. (B and C) Viral load was measured on day 4. (D) Cytokine RNA levels were measured by qPCR at the indicated time points. (E–H) Primary mouse neurons were infected with WNV 385-99 and harvested at the indicated time points. Data are presented as the mean ± SEM (n = 6 per group). (E) RNA levels of Peli1 in WT neurons on day 4 p.i. ##P < 0.01 compared with the noninfected group (unpaired, 2-tailed Student’s t test). (F and G) Viral load was measured at the indicated time points by qPCR (F) and FFA (G. (H) Il6, Ccl2, Ccl7, and Cxcl10 RNA levels were measured by qPCR at the indicated time points. (B–D and F–H) *P < 0.05 and **P < 0.01 compared with the WT group (unpaired, 2-tailed Student’s t test).

