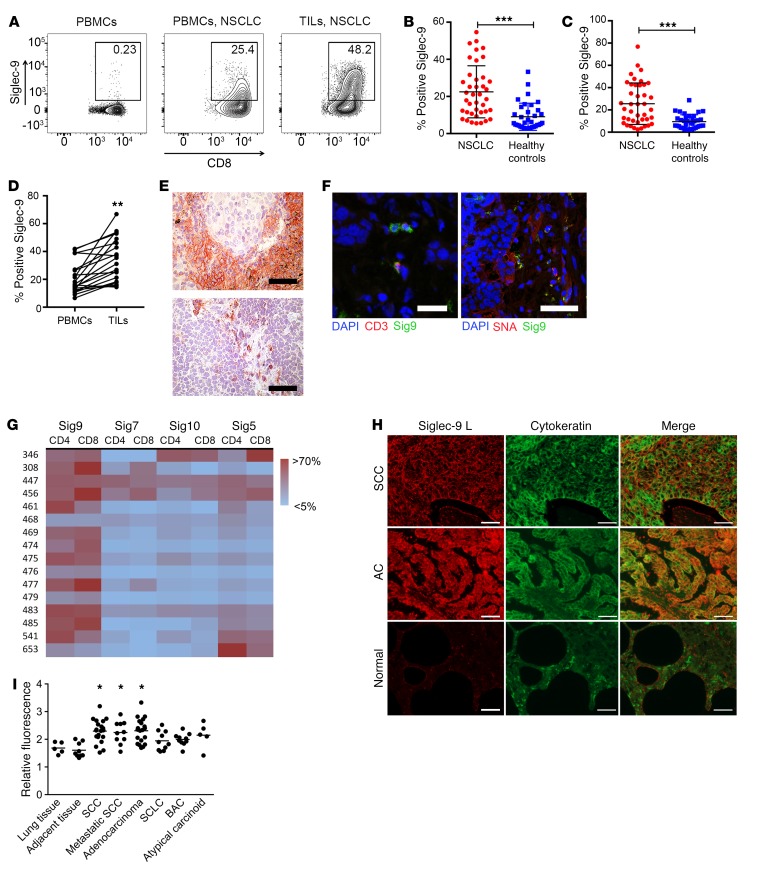
Figure 1. Siglec-9 is upregulated on CD8+ TILs.
(A) Representative flow cytometry analysis of Siglec-9 expression on CD8+ T cells in PBMCs from healthy donors (left panel), PBMCs from NSCLC patients (middle panel), and TILs from a matched NSCLC patient (right panel). (B and C) Quantification of Siglec-9 expression on CD4+ (B) and CD8+ (C) TILs from NSCLC patients (PBMCs, n = 36; NSCLC, n = 41; mean ± SD). Statistical analysis by unpaired Student’s t test. (D) Paired analysis of CD8+ T cells from the peripheral blood and tumors of NSCLC patients (n = 20). Statistical analysis by paired Student’s t test. (E) Immunohistochemical staining of Siglec-9–positive cells in NSCLC sections. Scale bars: 50 μm. (F) Representative immunofluorescence analysis of CD3 and Siglec-9 double-positive cells and Siglec-9 staining or SNA staining and Siglec-9 staining (right panel). Scale bars: 30 μm (left panel); 50 μm (right panel).(G) Heatmap of expression analysis of different Siglecs in NSCLC samples on CD4+ and CD8+ TILs. (H and I) Immunofluorescence study in paraffin-embedded tissue microarrays using recombinant Siglec-9–Fc (human IgG1) fusion protein coupled to secondary PE-conjugated (Fab′)2 goat anti-human Fc antibody. Representative images (H) and Siglec ligands quantification summary (I) are shown. Original magnification, ×400. Scale bars: 50 μm. Fluorescence values were normalized against an IgG1 isotype control. Lung tissue, n = 5; adjacent lung tissue, n = 9; squamous cell carcinoma (SCC), n = 20; adenocarcinoma, n = 20; small cell lung cancer (SCLC), n = 10; broncho-alveolar carcinoma (BAC), n = 10; atypical carcinoid, n = 5. Data are shown as mean ± SEM. Statistical analysis performed by 1-way ANOVA. *P < 0.05; **P < 0.01; ***P < 0.001.

