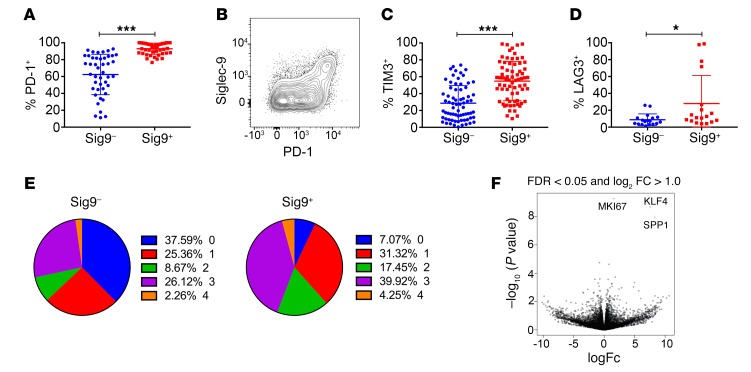
Figure 2. Sig9+CD8+ TILs coexpress inhibitory receptors.
(A and B) Expression of PD-1 in primary NSCLC samples on Sig9–CD8+ (Sig9–) or Sig9+CD8+ (Sig9+) TILs (A, n = 44) and representative FACS analysis (B). Statistical analysis by paired Student’s t test. (C and D) Expression of TIM-3 (C, n = 71) and LAG-3 (D, n = 18) on Sig9–CD8+ or Sig9+CD8+ TILs from NSCLC samples. Statistical analysis by paired Student’s t test. (E) Analysis of the number of coexpressed inhibitory receptors on Sig9–CD8+ or Sig9+CD8+ TILs. (F) Volcano plot of RNA-seq on sorted TILs according to their Siglec-9 expression. The 3 significantly differentially expressed genes were MIK67 (Ki67), KLF4, and SPP1. *P < 0.05; ***P < 0.001. Data are presented as mean ± SD.

