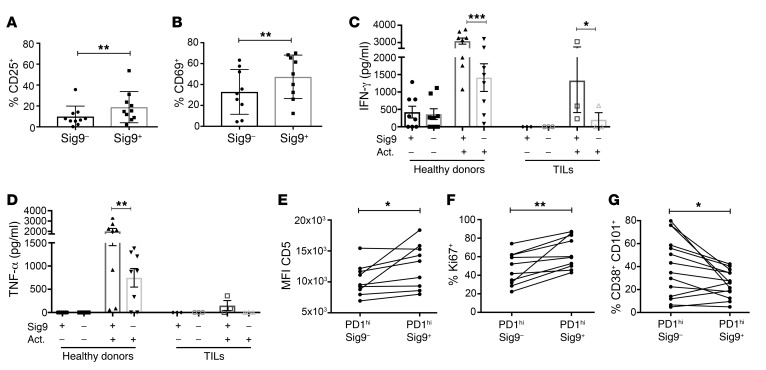
Figure 3. Sig9+CD8+ TILs are a distinct subset within intratumoral CD8+ T cells.
(A and B) Upregulation of the activation markers CD25 (A) and CD69 (B) on Sig9–CD8+ or Sig9+ TILs sorted from primary NSCLC samples and activated with anti-CD3/28 antibodies for 48 hours (n = 9). Statistical analysis by paired Student’s t test. (C) ELISA analysis of IFN-γ in the supernatant of sorted Sig9–CD8+ T cells or Sig9+CD8+ T cells (n = 3–7, independent patients). Cells were sorted from PBMCs of healthy donors or primary NSCLC samples (TILs). Act, activated. Supernatants from 50,000 cells were analyzed. (D) Analysis of TNF-α in the supernatant of sorted Sig9–CD8+ or Sig9+CD8+ cells from healthy donors or NSCLC patient samples (n = 3–7, independent donors/patients). Statistical analysis performed by 1-way ANOVA. (E) Expression level of CD5 in the CD8+PD-1hi population on Sig9– TILs and Sig9+ TILs (n = 9). (F) Percentage of Sig9–CD8+ TILs or Sig9+CD8+ TILs in primary NSCLC samples that express Ki67 within the PD-1hi population (n = 9). (G) Frequency of CD38hiCD101hi cells on Sig9– and Sig9+CD8+PD-1hi TILs determined by flow cytometric analysis (n = 13). Statistical analysis by paired Student’s t test. *P < 0.05; **P < 0.01; ***P < 0.001. Data are presented as mean ± SD.

