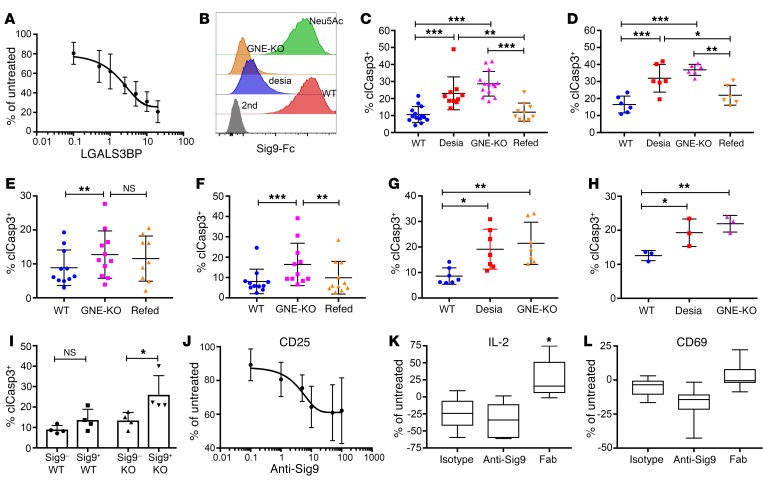
Figure 4. Sia-SAMPs inhibit T cell–mediated tumor cell killing in vitro.
(A) Inhibition of T cell activation by LGALS3BP in a dose-dependent manner measured by intracellular IFN-γ by flow cytometry. CD8+ T cells from healthy donors were activated with anti-CD3 and anti-CD28 antibodies in the presence of increasing amounts of LGALS3BP (μg/ml, n = 3). (B) Representative histograms of binding of Sig9-Fc to A549 WT cells, enzymatically desialylated A549 cells (desia), GNE-deficient A549 cells (GNE-KO), and GNE-KO A549 cells refed with 10 mM Neu5Ac. (C) Percentage of cleaved caspase-3–positive (clCasp3+) WT A549 cells, desialylated A549 cells, GNE-KO A549 cells, or GNE-KO A549 cells fed with Neu5Ac (refed) after incubation with CD8+ T cells and catumaxomab (n = 10). (D) Apoptosis of WT, desialylated, GNE-KO, and refed GNE-KO HT-29 cells measured by upregulation of cleaved caspase-3 in tumor cells (n = 6). (E and F) clCaps3+ A549 (E, n = 11) or HT-29 (F, n = 11) tumor cells after coincubation with TILs from NSCLC or CRC samples. (G) CD8+ T cells were sorted according to their Siglec-9 expression and incubated with either WT or GNE-KO A549 cells (n = 4). (H) CD19+ RAMOS cells were incubated with CD8+ T cells from healthy donors in the presence of CD3 and CD19 bispecific antibody blinatumomab (n = 7). (I) GNE-KO RAMOS cells incubated with CD8+ T cells from patients with chronic lymphocytic leukemia (n = 3). (J) Activation measured by CD25 on CD8+ T cells treated with anti-CD3 and anti-CD28 antibodies in the presence of anti–Siglec-9 antibody (clone 191240, g/ml, n = 4). (K) Relative IL-2 production of NSCLC primary tumor samples incubated with SEB and Siglec-9–blocking antibody and the Fab fragments (clone 191240, n = 5). (L) Measurement of CD69 upregulation on CD8+ TILs from NSCLC patients upon incubation with SEB in the presence of antibodies or Fab fragments (n = 5). Statistical analyses in this figure were performed by 1-way ANOVA. Data are presented as mean ± SD. *P < 0.05; **P < 0.01; ***P < 0.001.

