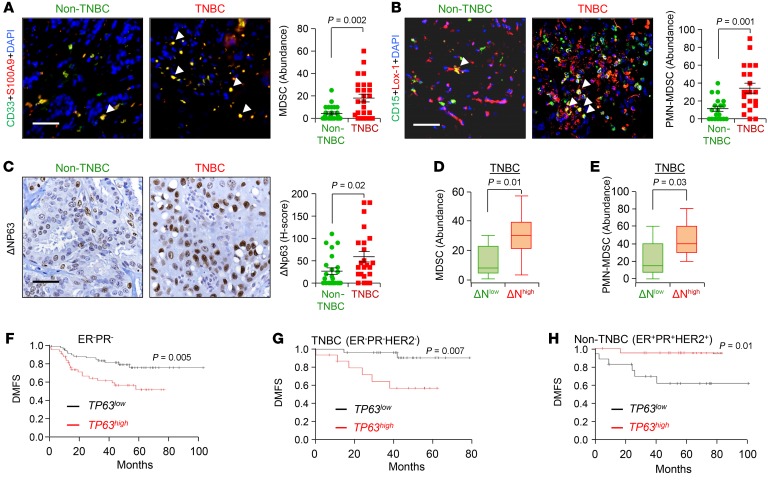
Figure 1. TNBC contains higher MDSC infiltration and high expression of ΔNp63, which is associated with reduced distant metastasis–free survival of human patients.
(A and B) Representative immunofluorescence (IF) images (left) and calculated abundance (right) for CD33 and S100A9 (A) and CD15 and Lox-1 (B). Increased costaining of CD33 and S100A9 (yellow) in TNBC patients indicates increased MDSCs in these patients. Increased costaining of Lox-1 and CD15 (yellow cells indicated with white arrowheads) further confirms that MDSCs in TNBC are PMN-MDSCs. (C) Representative IHC images (left) and calculated H-score (right) for ΔNp63 expression in patient tissues. The H-score value is the product of abundance of cells expressing respective protein (scale of 0–100) multiplied by the intensity of expression of that protein (scale of 0–3). (D and E) Box plot shows higher infiltration of MDSC (D) and PMN-MDSC (E) positivity in ΔNp63-high (ΔNhigh) than in ΔNp63-low (ΔNlow) human TNBC tumor samples. ΔNhigh and ΔNlow patients were stratified based on being above or below the median of ΔNp63 H-score in C. (A and B) Non-TNBC, n = 21 patient samples; TNBC, n = 22 patient samples. (D and E) TNBC, n = 22 patient samples. (F–H) High p63 (TP63) expression correlates with reduced distant metastasis–free survival (DMFS) in ER–PR– (F), TNBC (G), but not non-TNBC (H) clinical samples in the KM Plotter breast cancer database (30). Scale bars: 40 μm (A–C). (A–E) Mann-Whitney U test was used for scatter dot plots to quantify the difference between respective protein expressions. (F–H) Log-rank test was used for KM plots to calculate P value.

