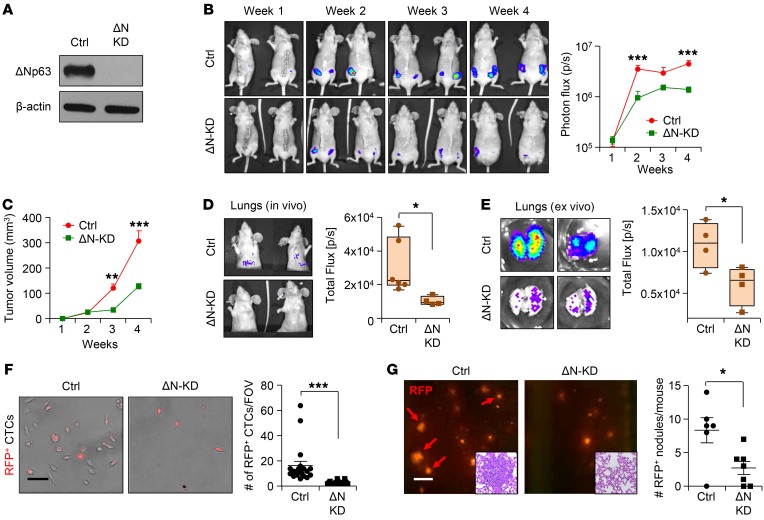
Figure 2. ΔNp63 promotes tumor growth, progression, and metastasis in human TNBC.
(A) Western blot shows ΔNp63 (ΔN) protein expression in control and ΔNp63-KD HCC1806 cells after shRNA lentivirus vector–mediated knockdown (KD). (B) Red fluorescence (RFP) and Renilla luciferase–expressing control and ΔNp63-KD HCC1806 cells (2 × 10⁵) were injected into the mammary fat pad of nude mice. Representative mouse images (left) and tumor growth (right; total flux, photons per second [p/s]) show bioluminescent signal from tumors in vivo. (C) Tumor growth curves show data of palpated tumor growth of indicated groups. (B and C) n = 10 tumors per group. Contralateral mammary glands (4th position) of n = 5 mice per group were used for injection. (D and E) Control and ΔNp63-KD HCC1806 tumor-bearing mice show in vivo (D) and ex vivo (E) lung metastasis by bioluminescence imaging. Ctrl, n = 6 mice per group; ΔN-KD, n = 4 mice per group. (F) Bright-field and fluorescence images show RFP+ circulating tumor cells (CTCs) after culture. CTCs were isolated from blood of control and ΔNp63-KD HCC1806 xenograft-bearing mice and cultured for 1 week. n = 5 mice per group. (G) HCC1806 cells (2 × 10⁵) were injected into the bloodstream of NSG mice via tail vein to study metastasis; a representative image of RFP+ lung metastatic nodules is shown (G, left, red arrows). Quantification of metastatic RFP+ nodules of indicated groups is shown at right. The insets show H&E images of sections of lung, showing metastatic nodule in control. Ctrl, n = 6 mice; ΔN-KD, n = 7 mice. (B and C) Two-way ANOVA was performed with Bonferroni post-test adjustment. (D–G) Mann-Whitney U test was used to compute P values. Scale bars: 40 μm (F) and 500 μm (G). Data are presented as the mean ± SEM from 3 independent experiments. *P < 0.05, **P < 0.01, ***P < 0.001. FOV, field of view.

