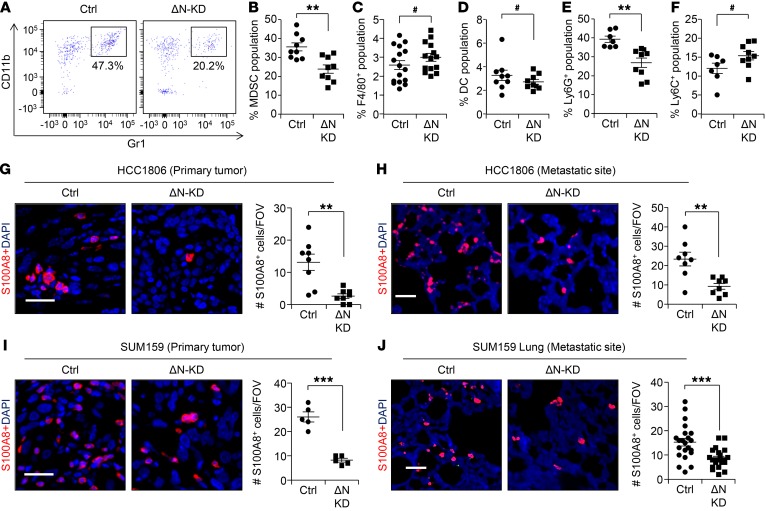
Figure 3. ΔNp63 promotes recruitment of MDSCs at primary tumor and metastatic site.
(A) Flow profile of CD45+ population of control and ΔNp63-KD HCC1806 tumor based on the staining of CD11B and Gr1 markers shows MDSC population. Fluorescence Minus One (FMO) negative control is shown in Supplemental Figure 7A. (B–D) Flow cytometric analysis depicts percentage of MDSCs (CD11B+Gr1+F4/80–) (B), macrophages (CD45+F4/80+) (C), and dendritic cells (DCs; CD45+CD11c+) (D) in primary tumors of indicated groups. (E and F) Flow cytometric analysis depicting MDSC subpopulations: PMN-MDSCs (CD45+CD11B+Ly6G+) (E) and M-MDSCs (CD45+CD11B+Ly6C+) (F). n is indicated in scatter plots for different groups in B–F. (G and H) Representative IF images show S100A8+ stained myeloid cells at the primary tumor (G) and metastatic site (H) of control and ΔNp63-KD HCC1806 cells. Scatter plots to the right show quantification of S100A8+ cells per FOV. (I and J) IF images show myeloid cells in primary tumor (I) and at metastatic site (J) of control and ΔNp63-KD SUM159 cells. Scatter plots to the right show quantification of S100A8+ cells. Scale bars: 40 μm (G–J). **P < 0.01, ***P < 0.001, #NS. Data are presented as the mean ± SEM. (B–J) Student’s t test was used to compute P values. (G–J) n = 3 samples were used, and several random fields were evaluated per sample for quantification from 3 independent experiments.

