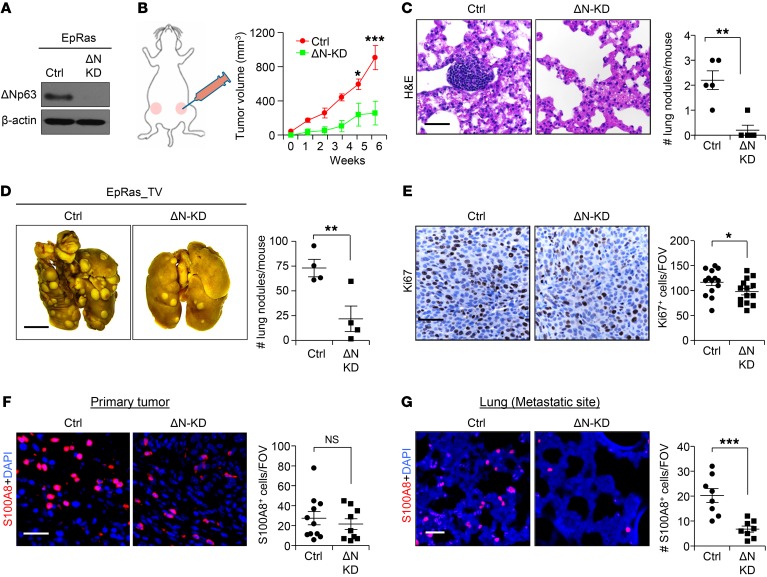
Figure 4. ΔNp63 promotes tumor growth, progression, and metastasis in mouse TNBC.
(A) Western blot shows ΔNp63 (ΔN) protein expression in EpRas cells after shRNA lentivirus vector–mediated knockdown (KD). (B) EpRas control and ΔNp63-KD EpRas cells (5 × 10⁴) were injected into the mammary fat pad of BALB/c mice. Schematic shows experimental approach (left) and tumor growth curve (right). Ctrl, n = 8 tumors; ΔN-KD, n = 6 tumors. (C) Representative H&E images of lung show metastatic nodule of indicated groups. n = 5 mice per group. (D) EpRas cells (2 × 10⁴) were injected into the bloodstream of BALB/c mice via tail vein (TV) to study metastasis. Representative images show lung nodules (left), and scatter plot (right) represents quantification. (E) Representative IHC images show the expression of cell proliferation (Ki67) in control and ΔNp63-KD EpRas primary tumors. Scatter plots (right) represents quantification. (F and G) Representative IF images show myeloid cell infiltration (S100A8) in the primary tumor (F) and lung metastatic site (G). Scatter plots (right) represent quantification of S100A8+ myeloid cells. (B) Two-way ANOVA was performed followed by Bonferroni post-test to compute P value. (C) Mann-Whitney U test was used to compute P value. (D–G) Student’s t test was used to compute P values. Scale bars: 40 μm (C and E–G) and 500 μm (D). Data are presented as the mean ± SEM. *P < 0.05, **P < 0.01, ***P < 0.001, #NS. (E–G) n = 3 samples were used, and several random fields per sample were evaluated for quantification from 3 independent experiments.

