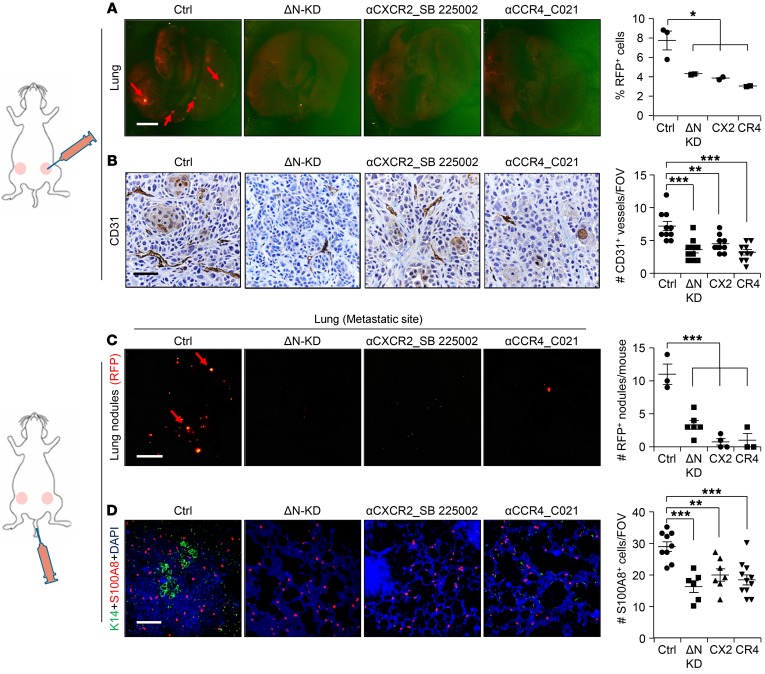
Figure 6. Blockade of MDSC recruitment inhibits metastasis.
(A, left) Representative lung images of tumor-bearing mice show RFP+ nodules (red arrows) upon indicated treatments. HCC1806 tumor cells (2 × 10⁵) were injected into mice. Treatment of mice was started 2 days before injection of tumor cells. (A, right) Flow analysis shows the quantification of metastasized RFP+ tumor cells to the lung. (B) Representative IHC images of primary tumor show CD31+ blood vessels in treated and untreated HCC1806 tumors; quantification is shown at right. (C) HCC1806 tumor cells (2 × 10⁵) were injected into the tail vein of NSG mice. RFP+ metastatic lung nodules upon indicated treatments are shown (red arrows). Quantification of RFP+ metastatic lung nodules is shown at right. (D) Representative IF images show the recruitment of S100A8+ cells in the lung upon tail vein injection of HCC1806 cells with indicated treatment (left) and quantification of S100A8+ cells (right). Tumor cells are stained with K14 (green). n is indicated in scatter plots. Scale bars: 500 μm (A and C) and 80 μm (B and D). *P < 0.05, **P < 0.01, ***P < 0.001. (A–D) P values were calculated using 1-way ANOVA with Tukey’s multiple-comparisons post hoc test. Data are presented as the mean ± SEM. (B) n = 3 samples were used, and several random fields per sample were evaluated for quantification from 3 independent experiments.

