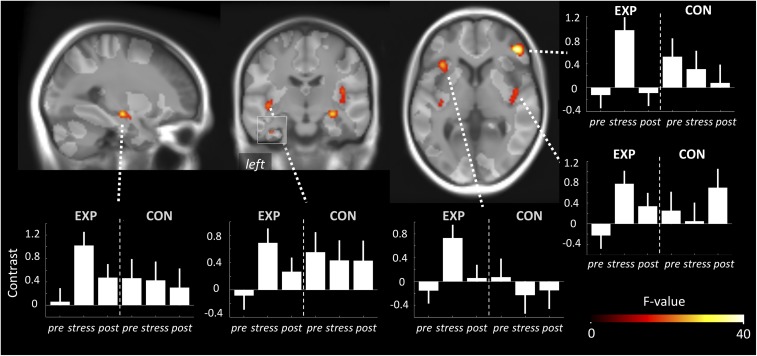
Fig. 3.
Effect of stress condition on HRF-PL. Sagittal, coronal, and axial projections on the group template depicting whole-brain significant clusters in which HRF-PL differed in the prestress and stress conditions in the EXP group (undirected F-test; Pcluster.FWE < 0.05; collection threshold Pvoxel < 10e-4). Graph bars represent the mean HRF-PL for peak voxels of these clusters throughout the three conditions for the EXP group and CON group. Note the reversible deflection during stress specifically within the EXP group. Importantly, this analysis was unconstrained by any hypothesis about the HRF-PL of the poststress condition. The bright transparent overlay marks areas with sufficient overall BOLD response for peak latency estimation.

