Fig. 1.
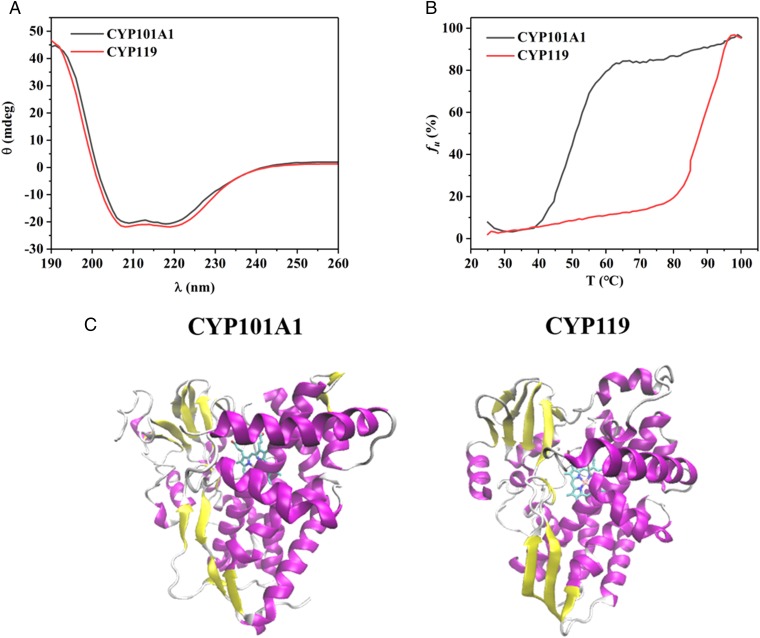
CD spectra and thermal melting curves of ligand-free CYP101A1 and ligand-free CYP119. (A) Comparison of far-UV CD spectra of CYP101A1 (black) and CYP119 (red). Spectra were acquired at 25 °C on a sample of each protein with a concentration of 5 µM in 50 mM potassium phosphate, 50 mM potassium chloride buffer, pH 7.4. (B) Comparison of thermal unfolding curves of CYP101A1 (black) and CYP119 (red). Unfolding of the secondary structure of each protein was monitored at a fixed wavelength of 222 nm as a function of increasing temperature, where fu is the unfolding fraction. Sample conditions were similar to those used in measurement of far-UV CD spectra in A. Experimentally measured ellipticity values were converted to percentage unfolded fraction fu as described in the text. (C) Crystal structures of (Left) ligand-free CYP101A1 (PDB ID code 3L61) and (Right) ligand-free CYP119 (PDB ID code 1IO7).

