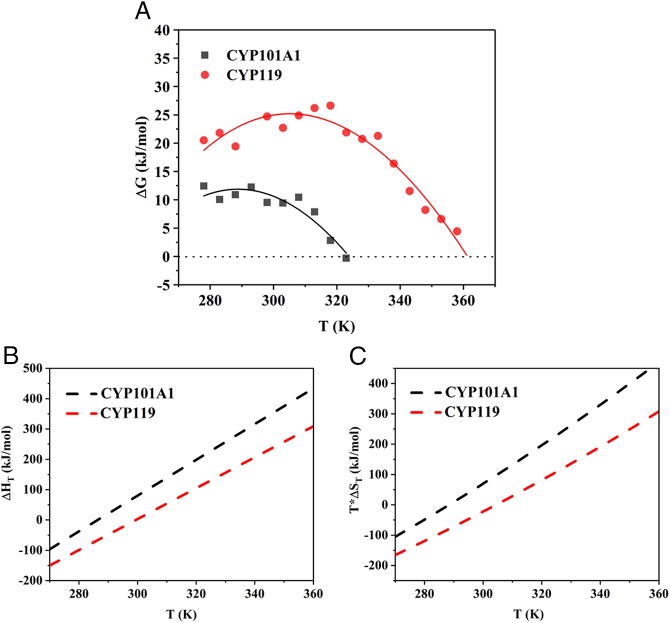
Fig. 2.
(A) Free energy stability curves for ligand-free CYP101A1 (black) and ligand-free CYP119 (red) determined by fluorescence dye method as described in Methods. The solid lines were fitted to the ΔG(T) points obtained at various temperatures by using Eq. 3, where ΔG(T) is the free energy of unfolding determined via chemical denaturation using GdnHCl as described in Methods and SI Appendix. (B) Enthalpy change (∆HT) and (C) entropy change (T*∆ST) during unfolding versus temperature for CYP101A1 (black) and CYP119 (red). Values of ∆HT and T*∆ST were derived from Eqs. 4 and 5, respectively. The dashed lines in the plot are illustrative lines for the enthalpy change and entropy change parameters for each protein as a function of temperature.

