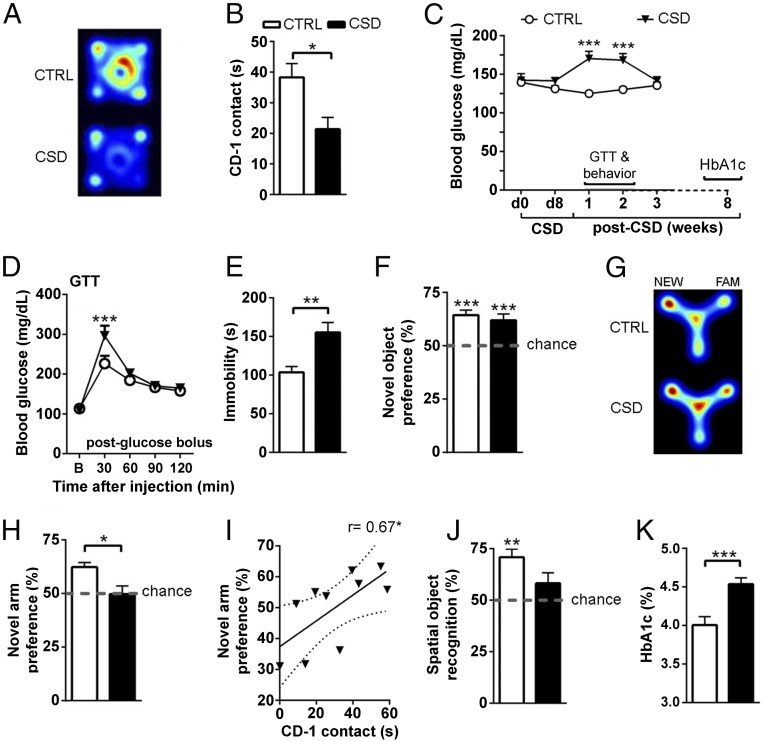
Fig. 2.
CSD perturbs glucose metabolism and affects behavior. (A and B) Control (CTRL) mice readily explore a cylinder containing an unknown CD-1 mouse placed in the center of an open field arena, but CSD-exposed mice show less exploration [depicted by representative heat maps (A) and quantified (B): t = 2.85, df = 16, P = 0.012, n = 9 per group]. (C) Peripheral hyperglycemia develops post-CSD and lasts ∼2 wk before returning to baseline [time: F(4,72) = 2.81, P = 0.032; CSD: F(1,18) = 12.68, P = 0.002; interaction: F(4,72) = 8.53, P < 0.001, n = 10 per group]. Glucose levels differed at 1 wk (t = 5.44, df = 90, P < 0.001) and 2 wk (q = 4.56, df = 90, P < 0.001) post-CSD. Behavioral testing (except the CD-1 encounter) and the GTT took place during this hyperglycemic period. Long-term effects of CSD were measured by HbA1c 8 wk post-CSD. (D) In the GTT, CSD-exposed mice displayed delayed recovery from a glucose bolus (2 g/kg i.p.) [interaction: F(4,72) = 3.64, P = 0.009; time: F(4,72) = 49.91, P < 0.001; n = 10 per group with differences at 30 min (t = 4.13, df = 90, P < 0.001)]. (E) CSD-exposed mice exhibited increased immobility time in the forced swim test compared with control mice (t = 3.17, df = 19, P = 0.005, n = 9–12 per group). (F) Novel object preference was intact with no CSD effects [performance against chance for control mice (t = 6.28, df = 18, P < 0.001) and for CSD-exposed mice (t = 4.15, df = 18, P < 0.001); CSD (t = 0.64, df = 36, P = 0.52, n = 19 per group)]. (G and H) Control mice explored the novel (NEW) arm of the Y-maze more than the familiar (FAM) arm, but CSD-exposed mice did not display this preference [depicted by representative heat maps (G) and quantified (H): against chance for control mice: t = 5.79, df = 9, P < 0.001; for CSD-exposed mice: t = 0.06, df = 9, P = 0.95; CSD: t = 2.86, df = 18, P = 0.01, n = 10 per group]. (I) CD-1 exploration correlated positively with novel arm preference in the Y-maze; the regression line is shown with the 95% confidence interval (dotted lines) (r = 0.67, r2 = 0.45, P = 0.034). (J) Control mice displayed a preference for the replaced object in the object location task (t = 5.23, df = 14, P < 0.001), but this preference was not seen for CSD-exposed mice (t = 1.62, df = 12, P = 0.13). (K) HbA1c in the peripheral blood was increased for stressed mice 8 wk post-CSD (t = 3.96, df = 19, P < 0.001, n = 10 or 11 per group). Data are presented as mean + SEM; *P < 0.05, **P < 0.01, ***P < 0.001, Student’s t test in B, E, F, H, and J; one-sample t test against chance in F and H; Pearson’s correlation coefficient in I; one-way repeated-measures ANOVA with Bonferroni’s posttest in C; or two-way repeated-measures ANOVA with Bonferroni’s posttest in D.

