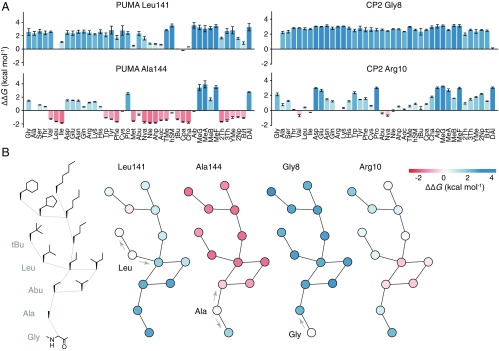
Fig. 3.
Structure–activity relationships at single-atom resolution. (A) ∆∆G for each proteinogenic and nonproteinogenic mutation at position L141 and A144 in PUMA (Left), and G8 and R10 in CP2 (Right). (B, Left) Graph of amino acid side chains in which edges represent the insertion or deletion of a single aliphatic carbon atom. Other graphs, Left to Right, show nodes colored according to ∆∆G [stabilizing (red) and destabilizing (blue)] for mutations at L141 and A144 of PUMA, and G8 and R10 of CP2. Arrows highlight single carbon atom changes to the wild-type side chain.

