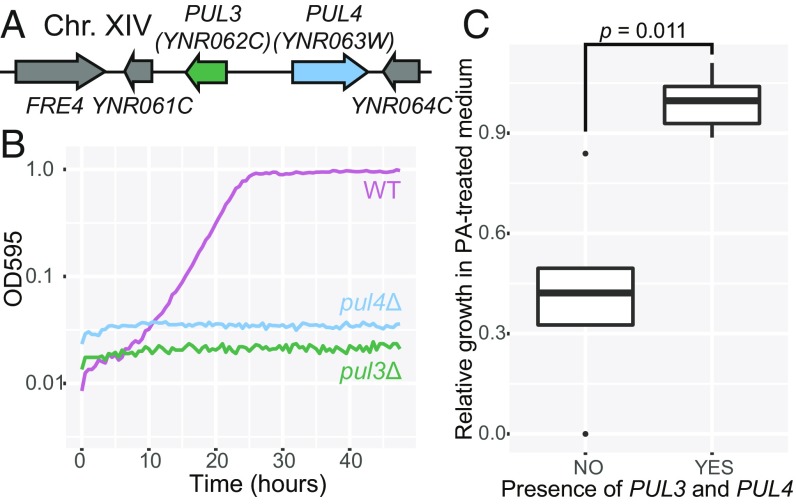
Fig. 3.
(A) Gene arrow diagram depicting the location and arrangement of the partial PUL gene cluster in S. cerevisiae. (B) Representative growth curves of pul mutants of S. cerevisiae in PA-treated medium, where cells must uptake pulcherrimin to grow. (C) PA-treated:untreated growth rate ratios for pairs of congeneric species containing or lacking PUL3 and PUL4 homologs. Boxplots contain the mean growth rate ratio from three biological replicates for each of the five species in each group. The “YES” group is composed of species containing PUL3 and PUL4, and the “NO” group is comprised of closely related species lacking one or both genes. P is the result of a paired Student’s t test.

