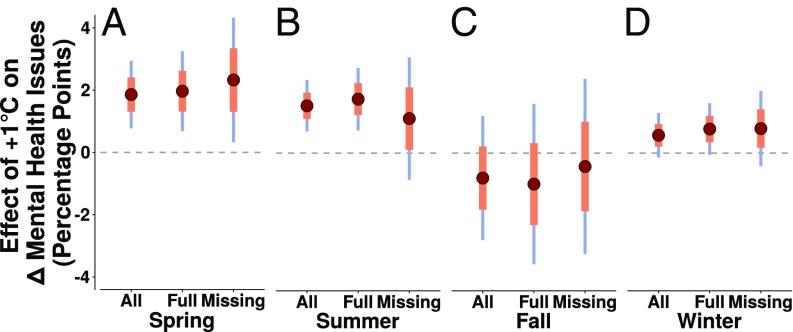
Fig. 4.
Multiyear warming and prevalence of mental health problems across the seasons of the year. A plots the results of estimating the long-differences model for spring, B plots the results of estimating the long-differences model for summer, C plots the results of estimating the long-differences model for fall, and D pots the results of estimating the long-differences model for winter. Orange error lines represent one SE, and blue lines represent 95% confidence intervals.

