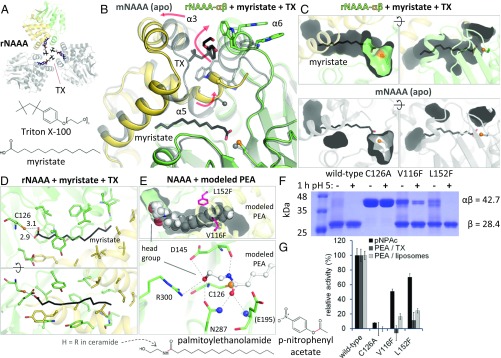
Fig. 3.
Substrate binding by NAAA. (A) Crystal arrangement of rNAAA, with crystallographic symmetry copies in gray and TX molecules as colored sticks. (B) Comparison of mNAAA apo form (transparent gray) with rNAAA (yellow and green) bound to myristate and TX (black sticks). Secondary structure elements are labeled. Rearrangements that occur in presence of detergent are illustrated by red arrows. The last residue visible in the mNAAA α-subunit electron density is marked by a sphere in both structures. (C) As in B, these conformational changes produce a cavity where the fatty acid is inserted (Top), whereas this ligand would not fit into the apo protein (Bottom). (D) Residues lining the cavity are displayed as sticks, with interatomic distances (in angstroms). (E) PEA was manually placed into the rNAAA substrate-binding site and is shown as full-scale spheres (Top). Potential hydrogen bonds between PEA and active site residues (Bottom, human numbering) are represented by dashed lines, including to the oxyanion hole atoms (blue spheres). The location of ethanolamine or bulky artificial head groups is labeled. (F) Proteolytic self-activation upon incubation at acidic pH of two hNAAA point mutants designed to partially block substrate binding; these residues are displayed as pink sticks in E. Calculated molecular weights of the glycosylated precursor and of the active enzyme’s β-subunit are provided. (G) Relative in vitro hydrolysis rates of p-nitrophenyl acetate (pNPAc), PEA in TX micelles, and PEA in liposomes. Full activity corresponds to: 0.05 μM pNPAc/nM NAAA per hour (means and SDs of a representative of two experiments performed in quadruplicates); 2.2 μM PEA in TX/nM NAAA per hour (means and SDs of three experiments performed in quadruplicates); 0.7 μM PEA in liposomes/nM NAAA per hour (means and SDs of a representative of three experiments performed with n = 8). In the substrate chemical structures, the scissile bond is in red.

