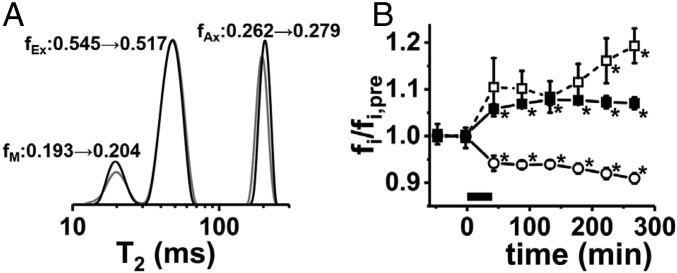
Fig. 5.
(A) An example of prestimulation (gray) and poststimulation (black) T2 spectra acquired from a perfused frog sciatic nerve. The CPMG echo-trains acquisitions (4,096 echoes spaced by 1 ms, TR = 20 s, 16 averages, 5 min and 20 s per measurement) were interleaved between the diffusion fMRI time points. T2-based signal fractions fM (myelin), fEx (extracellular), and fAx (axonal) are shown. (B) Group-averaged evolution of the T2 signal components vs. time revealed by dynamic T2 spectroscopy (n = 5, error bars represent SEM). Here, the nerve T2 signal fractions, fi, are normalized such that their prestimulus average is 1, so the dynamics of the three signal components can be displayed in a single plot (fM/fM,pre, open squares; fAx/fAx,pre, filled squares; fEx/fEx,pre, open circles). The period of applied electrical stimulation (100 Hz × 40 min) is represented by the black bar from 0 to 40 min along the x axis. Statistically significant differences from the prestimulus measurement (repeated-measures ANOVA/Tukey post hoc testing) are indicated by an asterisk.

