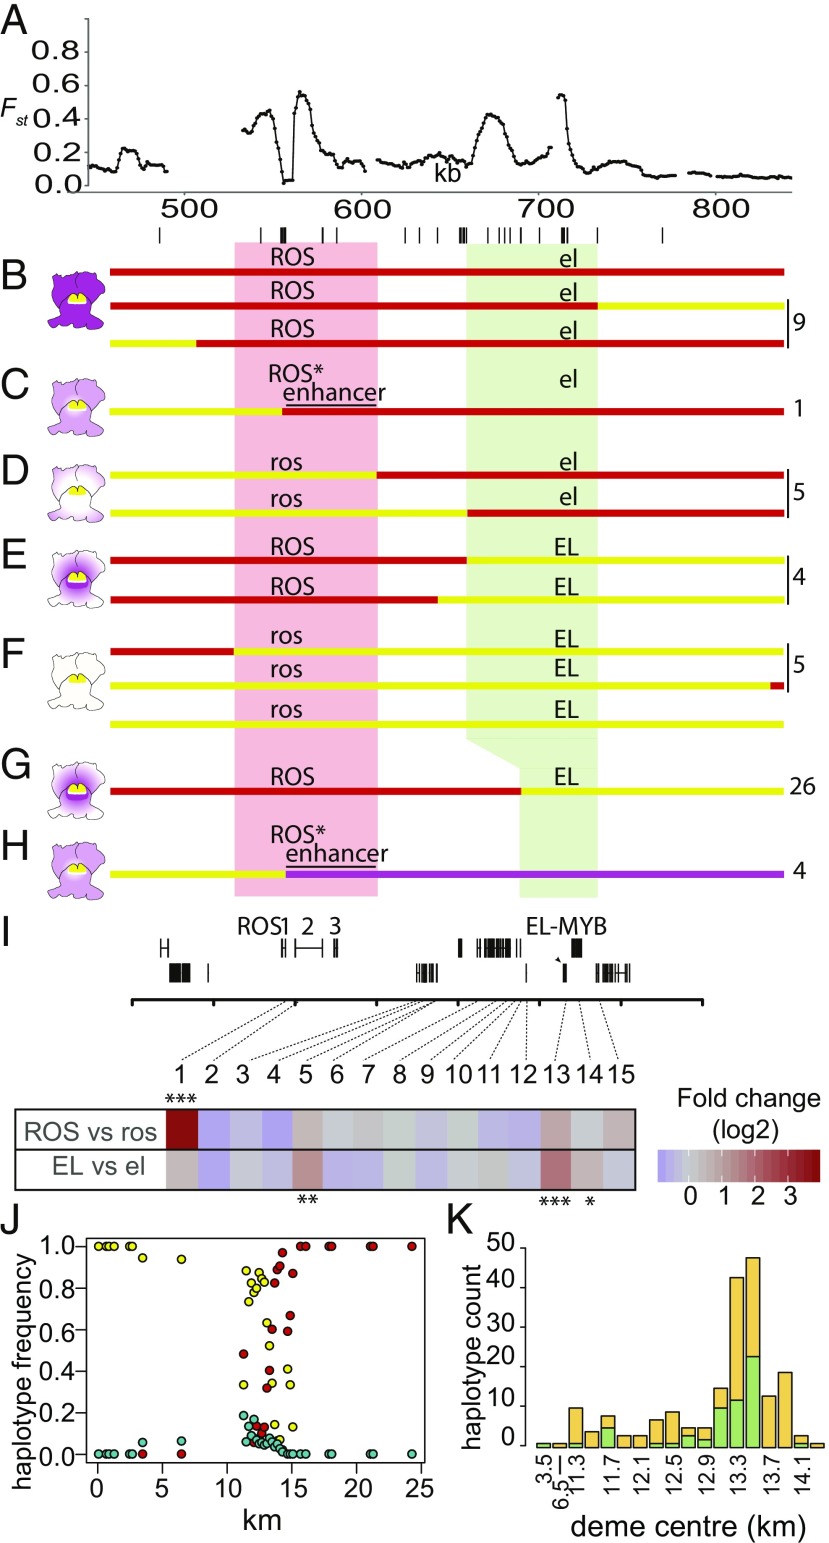
Fig. 4.
Mapping loci in relation to Fst peaks. (A) Fst profile for pools in Fig. 2B (YP1 vs. MP2) showing location of genes and markers (lines below) used for mapping. (B–H) Mapping ROS and EL. Pale red and pale green boxes indicate mapping intervals for ROS and EL, respectively. Parental haplotypes shown as lines in red (A. majus JI7), magenta (A.m.pseudomajus), or yellow (A.m.striatum). Recombination to the left and right of the Fst peak gives parental phenotypes (B and F); recombination 3′ of ROS1 gives pale magenta (C and H); recombination between ROS and EL gives very pale (D) or restricted (E) patterns. Numbers of each class recovered shown, Right. (I) Floral bud expression of 15 genes found in or between the ROS and EL mapping intervals. Significant differential expression for ROS vs. ros or EL vs. el comparisons at q (false discovery rate) < 0.05, q < 0.01, and q < 0.001 is indicated by one, two, or three asterisks, respectively. Only genes with a mean expression of >5 transcripts per million are shown. The sole gene in the region with significant differential expression in ROS vs. ros comparisons was ROS1 (q < 5.6e−29). EL-MYB showed the most significant differential expression in the EL vs. el comparison (q < 2.3e−9) with two further genes (Gene 5, which is outside the mapped EL interval) and Gene 14, which is immediately adjacent to EL-MYB) reporting differential expression at lower significance thresholds. (J) Frequency of A.m.pseudomajus (magenta), A.m.striatum (yellow), and recombinant (turquoise) haplotypes in demes with ≥8 individuals along the hybrid zone transect. (K) Barplot showing counts of recombinant haplotypes for all demes with ≥8 individuals (ross elp in green; ROSp ELs in orange). Deme center locations between 11.3 and 14.3 km are at 0.2-km intervals. For details of genotyping, see SI Appendix, Supplementary Text S3.

