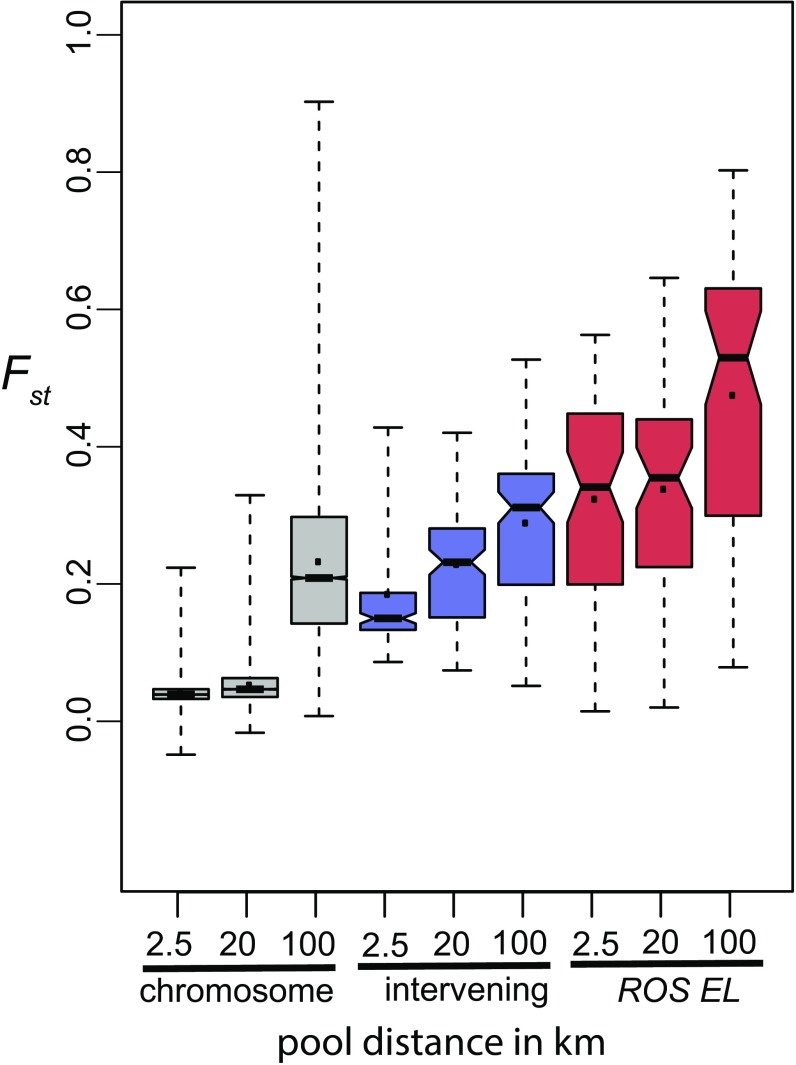
Fig. 5.
Relative divergence between populations at different geographic locations. Notched boxplots of Fst for three genomic regions: chromosome 6 (gray, from position >35 Mb excluding the ROS/EL region), interval between ROS and EL (blue), and the ROS and EL loci (pink). For each boxplot: the horizontal waistline indicates the median, the point indicates the mean, the length of the waist indicates the 95% confidence interval of the median, the box indicates the interquartile range, and the whiskers extend to the data minima and maxima. For each genomic region, three A.m.striatum/A.m.pseudomajus comparisons are shown, separated by 2.5 km (YP1 and MP2), 20 km (YP4 and MP11), or 100 km (ML-CIN). Distributions are based on values calculated for 10-kb windows, 1-kb step size. Windows overlying ROS and EL: midpoints 530–575 kb and 707–720 kb on ROS scaffold. Windows between ROS and EL: midpoints 576–706 kb on ROS scaffold.

