Fig. 1.
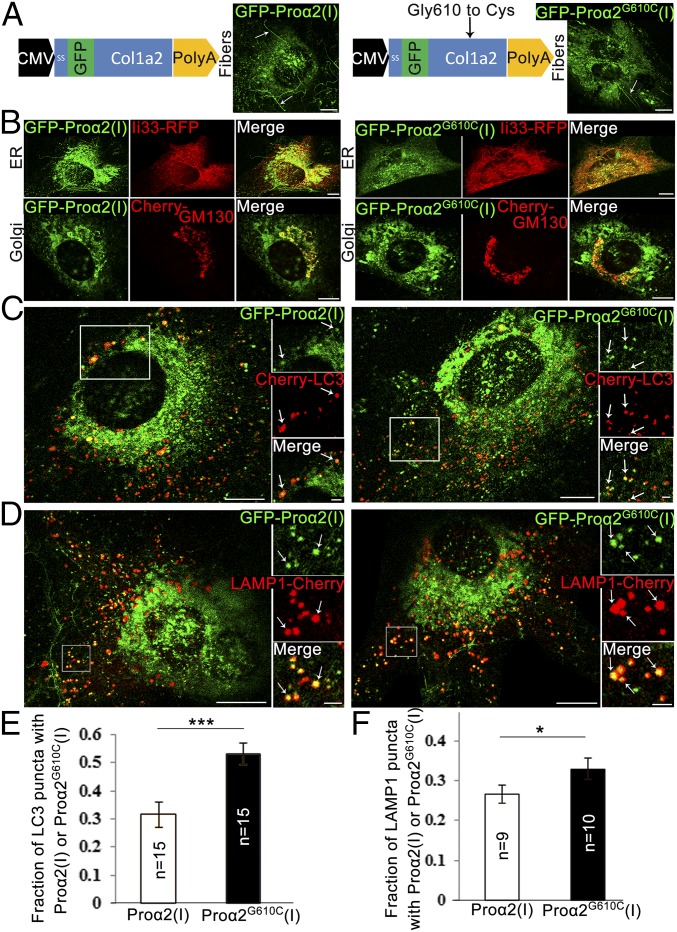
GFP-proα2(I)–tagged procollagen progresses through secretory and autophagic degradation pathways. (A) Schematic representation of GFP-proα2(I) (Left) and GFP-proα2G610C(I) (Right) constructs. Images show integration of procollagen molecules containing these chains into extracellular fibers (arrows) produced by transfected MC3T3 cells. (B) MC3T3 cells transfected with GFP-proα2(I) (Left) and GFP-proα2G610C(I) (Right) as well as markers of ER (Ii33-RFP) and cis-Golgi (Cherry-GM130) to visualize progression through the secretory pathway. (C and D) MC3T3 cells transfected with GFP-proα2(I) (Left) and GFP-proα2G610C(I) (Right) chains as well as markers of autophagic membrane (Cherry-LC3 in C) or lysosomal membrane (LAMP1-Cherry in D). Arrows point to selected puncta containing procollagen and LC3 or LAMP1. (E and F) Fractions of LC3 puncta (E) and LAMP1 puncta (F) containing procollagen (calculated as shown in SI Appendix, Fig. S6). Graphs display mean values ± SEM; *P < 0.05, ***P < 0.001. All images in A–D are confocal single slices. [Scale bars: 10 µm (whole cell) and 2 µm (zoom).] Procollagen colocalization with LC3 or LAMP1 near dense ER regions (C) was less obvious than in distal regions (D). We therefore used a conservative counting algorithm, which always undercounted rather than overcounted colocalized puncta (SI Appendix, Fig. S6).

