Fig. 3.
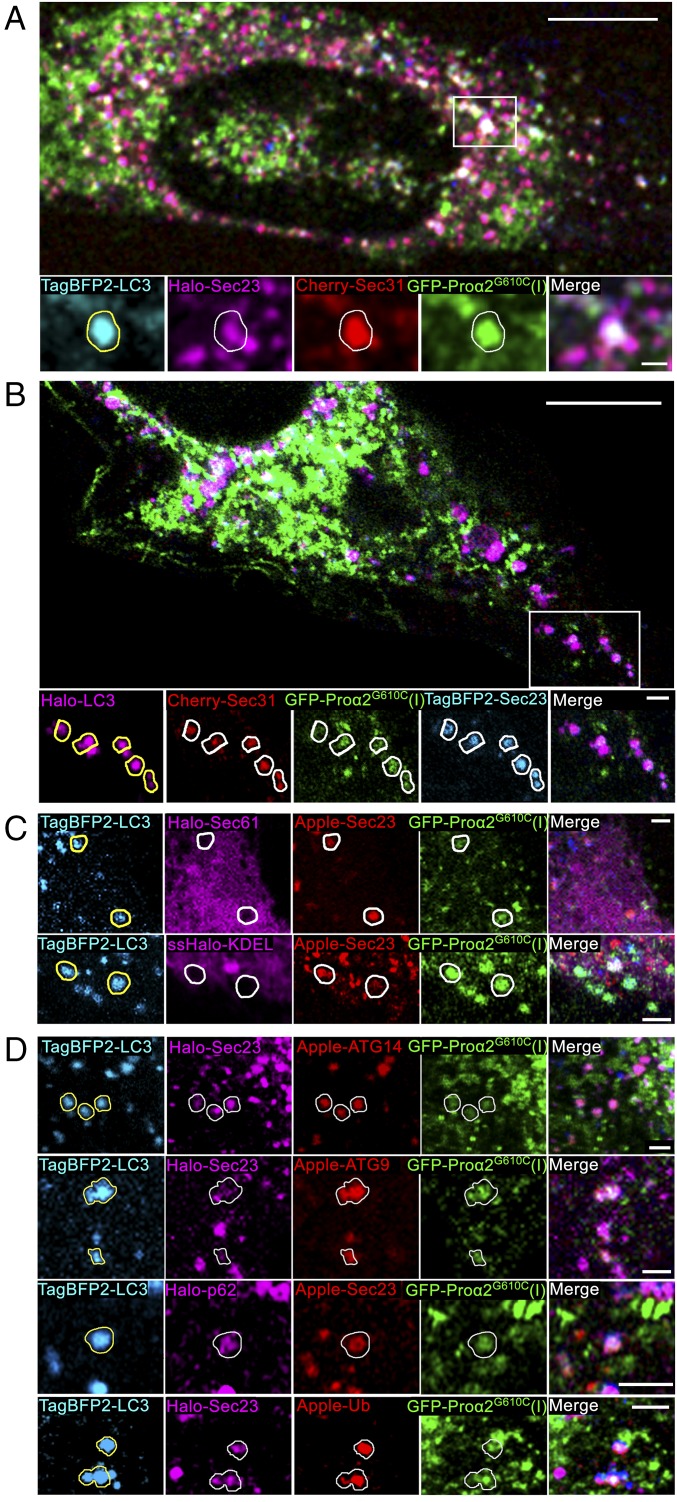
Misfolded procollagen enters autophagic structures at ERES. (A) Procollagen autophagic structures marked with GFP-proα2G610C(I) and TagBFP2-LC3 were imaged in MC3T3 cells also transfected with FP-tagged components of COPII coat Cherry-Sec31 and Halo-Sec23. Outline of an LC3-positive punctum is projected onto the other channels in zoomed confocal single-slice images to visualize colocalization. Colocalization was confirmed by analysis of the full 3D z-stack (SI Appendix, Fig. S4). (B) Similar imaging of TagBFP2-Sec23 and Cherry-Sec31 colocalization with procollagen autophagic structures positive for GFP-proα2G610C(I) and Halo-LC3. LC3 puncta outlines show only the structures in which the colocalization was confirmed by 3D z-stack analysis (SI Appendix, Fig. S4). The number of FP-Sec23/FP-proα2(I)G610C/FP-LC3 colocalized puncta represented 9.8 ± 1.4% of total LC3 puncta (n = 21 cells) and 4.7 ± 0.7% of total Sec23 puncta (n = 20 cells). (C) None of the puncta marked with GFP-proα2(I)G610C, TagBFP2-LC3, and FP-Sec23 (arrows) contained either Halo-Sec61 (ER membrane) or ssHalo-KDEL (ER lumen) markers. (D) Puncta marked with FP-Sec23, GFP-proα2G610C(I), and TagBFP2-LC3 also contained autophagic markers Apple-ATG14, Apple-ATG9, Halo-p62, or Apple-Ub. Images of C, Bottom are Airyscan single slices; all other images are confocal single slices. In all images, individual blue channels are displayed in cyan for better visualization. [Scale bars: 10 µm (whole cell) and 2 µm (zoom).]

